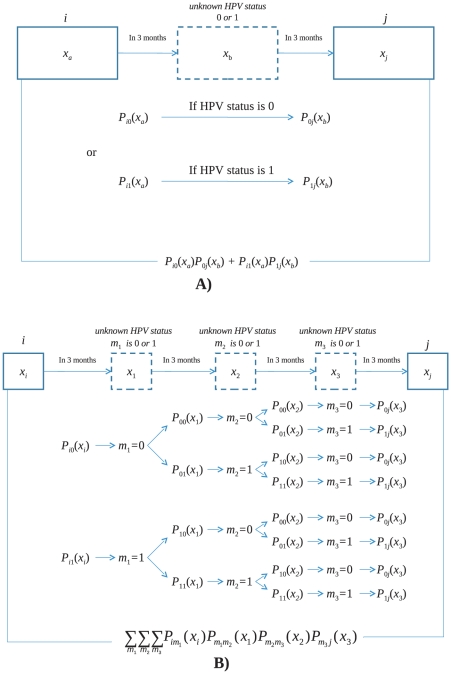
Figure 1. Reconstruction of information about the missed measurements when one HPV status is unknown ( Figure 1A ) or several (e.g., three) HPV statuses in a raw are missed ( Figure 1B ).
Here,  denotes the set of predictors of HPV clearance probability, such as CD4 count, HIV-1 VL, HAART, and HPV type. When one HPV measurement is unknown (Figure 1A), i and j describe the HPV status at the first and third visits, respectively, and parameters
  and
and  denote the sets of predictors for transitions between first-to-second and second-to-third visits, respectively. The probability of changing HPV status from the first (i.e., known) state of HPV infection i to the status of HPV infection at the second visit (i.e., unknown) is Pi
0(xa) when HPV status at the second visit is negative (i.e., “0”) or Pi
1(xa) when it is positive (i.e., “1”). Respectively, at the third visit (with measured/known HPV status) HPV status j can be defined as P
0j(xb) when at the second visit it supposed to be HPV-negative, and P
1j(xb) when at the second visit it supposed to be HPV-positive. The sum over two possible intermediate states contributes to the total transition probability: so, the transition probability between two subsequent visits with measured HPV status could be presented as
  . When three subsequent HPV status are unknown (Figure 1B), there are eight different combinations of HPV statuses in these states, each denoted by
  ,
,  , and
, and  as unmeasured HPV statuses which can be 0 or 1). Therefore, the transition probability between states with known HPV statuses is calculated as three-fold sum over all combinations of HPV statuses in these three unmeasured states.

