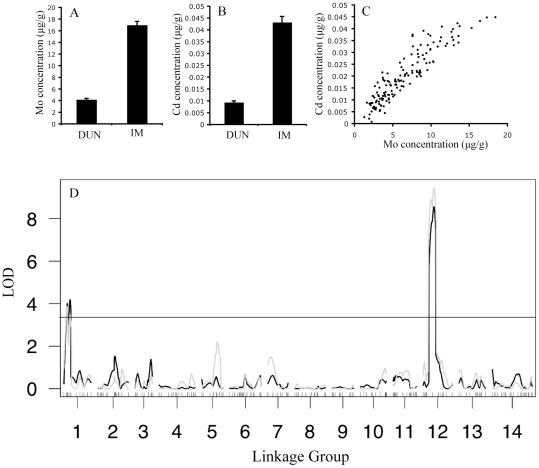
Figure 1. The relationship between Mo and Cd in the second experiment.
Mean (+/−SE) of A) Mo and B) Cd leaf ion concentrations in DUN10 and IM62 lines. C) Strong genetic correlation between Mo and Cd in the RILs. D) QTL map shows overlap in the genetic architectures of Mo (black) and Cd (gray) leaf accumulation.

