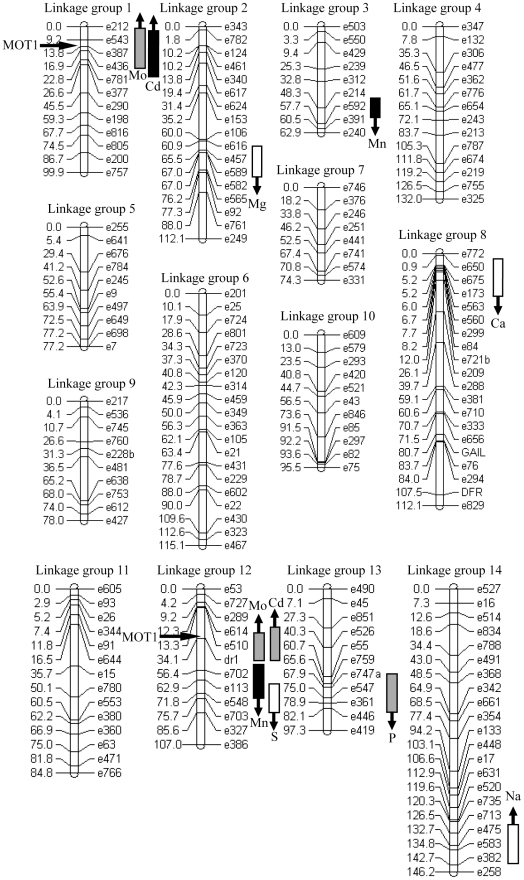
Figure 2. Locations of elemental accumulation QTLs.
QTLs for experiment 1 (white), experiment 2 (black), and both experiments (gray) are plotted as 1.5 LOD intervals on the linkage map of the RILs. Locations of the two major homologues of MOT1 are also plotted on the map. Up arrows indicate greater accumulation by the IM allele, while down arrows indicate greater accumulation by the DUN allele.

