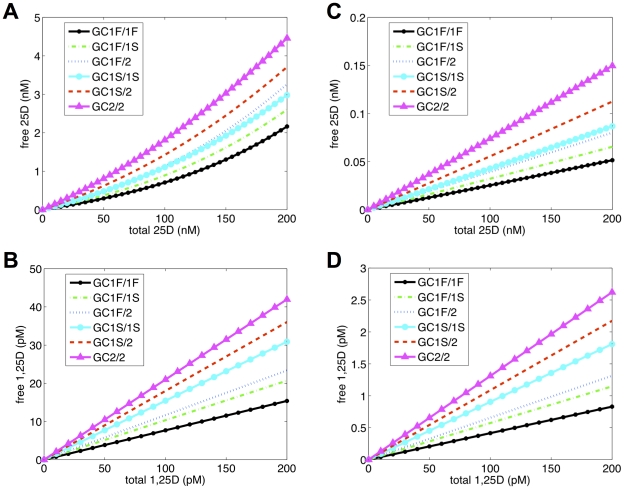
Figure 2. Effects of DBP genotype on free 25OHD and 1,25(OH)2D in vitro and in vivo.
eSS-predicted levels of free 25OHD and 1,25(OH)2D relative to total serum levels of these metabolites for in vitro tissue culture conditions (5% serum) and in vivo (100% serum) according to DBP genotype (GC allele combinations). X-axis indicates total serum concentrations of 25OHD (nM) or 1,25(OH)2D (pM) and Y-axis indicates concentration of free 25OHD or 1,25(OH)2D. Concentration of (A) 1,25(OH)2D = 5 pM (5% serum), (B) 25OHD = 2.5 nM (5% serum), (C) 1,25(OH)2D = 100 pM (100% serum) or (D) 25OHD = 50 nM (100% serum) were fixed.

