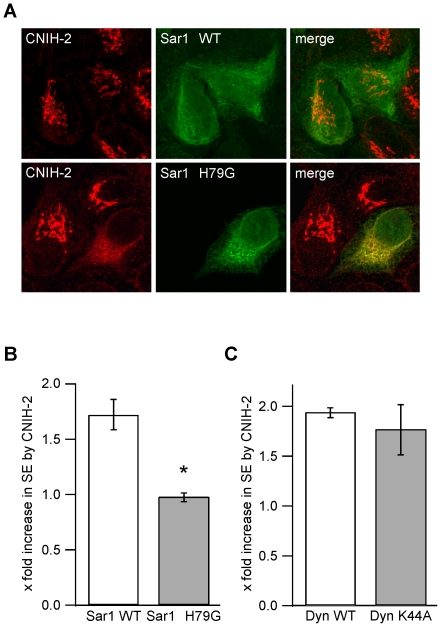
Figure 3. CNIH-2 facilitates ER export of AMPARs.
A Representative confocal images of OK cells stably expressing CNIH-2. Co-expression of dominant-negative Sar1 H79G prevents ER export of CNIH-2 leading to its redistribution into the ER. B Quantification of GluA1o surface expression levels by extracellular epitope tagging in the presence of CNIH-2 and either wildtype (WT) Sar1 (white bar) or mutant Sar1 H79G (grey bar). Data are mean increases in surface expression levels by CNIH-2 ± SEM normalized to GluA1o+Sar1 WT or GluA1o+Sar1 H79G without CNIH-2, respectively. Asterisk marks a significant increase in surface expression of GluA1o by co-expression of CNIH-2 (p<0.001, unpaired Student's t-test; n = 12 for both experimental groups). C Quantification of GluA1o surface expression levels in the presence of CNIH-2 and either wildtype dynamin-1 (white bar) or dominant-negative dynamin-1 K44A (grey bar) inhibiting clathrin-dependent endocytosis [38]. Data are mean increases in surface expression levels by CNIH-2 ± SEM normalized as in B (n = 6 for both experimental groups).

