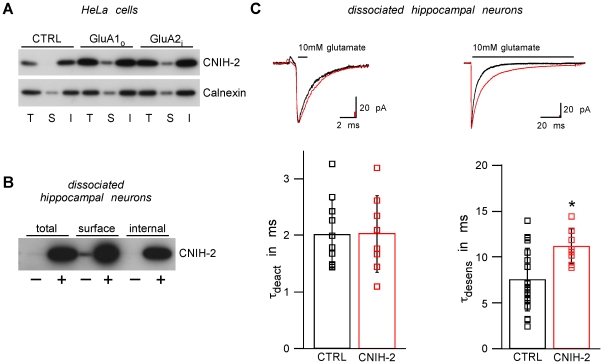
Figure 6. CNIH-2 is rendered a surface membrane protein by assembly with AMPARs.
A Total (T), surface (S) and internal (I) populations of CNIH-2 in HeLa cells expressing either CNIH-2 alone (CTRL) or together with GluA1o or GluA2i, respectively. S is concentrated 10fold. Note that in the absence of GluAs, CNIH-2 cannot be detected in the surface fraction. However, it is robustly observed in the plasma membrane when co-expressed with GluAs (n = 4). B Total (T), surface (S) and internal (I) populations of CNIH-2 in dissociated hippocampal neurons (DIV 17) transduced with CNIH-2 (+) or GFP (−). S is concentrated 10fold. Both endogenous (−) and over-expressed (+) CNIH-2 can be detected on the cell surface (n = 5). C (Top) Representative current traces recorded in somatic outside-out patches excised from dissociated hippocampal neurons (DIV 16–21) over-expressing either GFP (CTRL, black) or CNIH-2 (CNIH-2, red) upon 1 ms (left panel) and 100 ms applications (right panel) of 10 mM glutamate. (Bottom) Quantification of deactivation and desensitization kinetics. Data are given as mean ± SD. Asterisk denotes a significant difference from control (p<0.01, unpaired Student's t-test; deactivation: n = 10 and 8 for CTRL and CNIH-2, respectively; desensitization: n = 19 and 8 for CTRL and CNIH-2, respectively).

