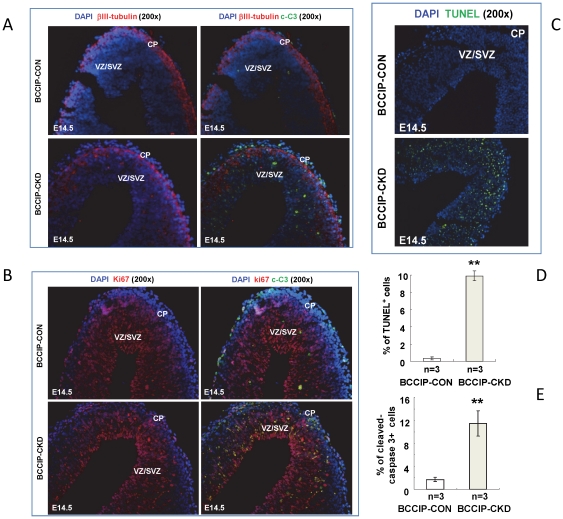
Figure 5. BCCIP knock-down increased apoptosis in the mitotic proliferating region of BCCIP-CKD neocortices.
(A) βIII-tubulin staining identifies the differentiating neural cell populations. Analysis of apoptosis was done by cleaved-caspase 3 (c-C3) staining in E14.5 using BCCIP-CON and BCCIP-CKD embryos. The merged composites are overlay of βIII-tubulin and DPAI staining. (B) Ki67 staining identifies the proliferating mitotic region. Analysis of apoptosis was done by cleaved-caspase 3 (c-C3) staining in E14.5 using BCCIP-CON and BCCIP-CKD embryos. (C) Apoptosis was analyzed by TUNEL assay in E14.5 using BCCIP-CON and BCCIP-CKD embryos. (D) Quantification of TUNEL staining. The amount of apoptosis was quantified in the VZ/SVZ of E14.5 embryos. (E) Quantification of cleaved-caspase 3 staining. The amount of apoptosis was quantified in the VZ/SVZ of E14.5 embryos. CP: cortical plate. VZ/SVZ: ventricular zone/subventricular zone. White bars: BCCIP-CON; Gray bars: BCCIP-CKD. The merged composites are overlay of Ki67 and DAPI staining. CP: cortical plate. VZ/SVZ: ventricular zone/subventricular zone. *: P<0.05; **: P<0.01; ***: P<0.001.

