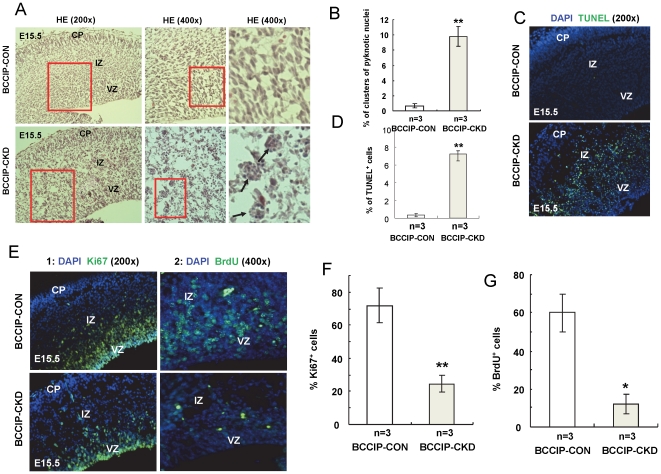
Figure 6. BCCIP knock-down causes apoptotic cell death and reduction of cell proliferation capacity in the neocortices progenitor cells.
The brain tissues form E15.5 embryos were subjected to IHC and H&E staining analyses. In all panels: CP - cortical plate; IZ - intermediate zone; VZ - ventricular zone. (A) illustrates the magnified views of H&E staining of littermate BCCIP-CON and BCCIP-CKD brain sections. Representative of clusters of pyknotic cell nuclei in the BCCIP-CKD ventricular zone are indicated by arrows. The right panels of 6A show the enlarged images of selected areas of the middle panels. (B) Quantification of clusters of pyknotic nuclei. (C) The apoptotic cells from the same were detected by TUNEL staining. (D) Quantification of TUNEL staining. (E) Proliferative cells were detected by anti-Ki67 staining (column 1), and BrdU incorporation (column 2) at E15.5 (about 2 days after the GFAP-Cre is expressed). (F) Quantification of Ki67 staining. (G) Quantification of BrdU staining. Error bars are standard deviation. White bars: BCCIP-CON; Gray bars: BCCIP-CKD. The asterisks indicate the statistic significance between the BCCIP-CON and BCCIP-CKD, *: P<0.05; **: P<0.01; ***: P<0.001.

