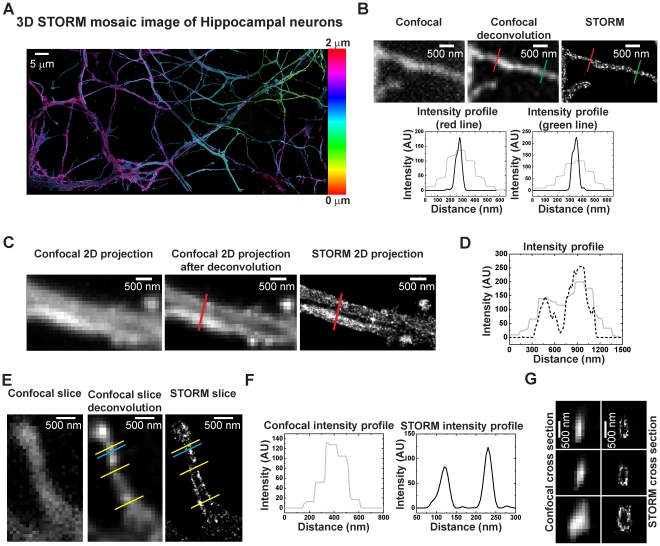
Figure 2. Single color 3D imaging of hippocampal neurons by STORM and confocal.
(A) Mosaic 3D STORM image of hippocampal neurons. The color indicates z-position information according to the colored scale on the right. This image spans a volume of 147×80×1.4 µm (B) A zoomed-in view showing 2D maximum intensity projection of a neural process in confocal (left), confocal after deconvolution (middle). and STORM (right). The left graph shows the intensity profile in the deconvoluted confocal image (grey plot) and the STORM image (black plot) across the red line indicated on both images. Similarly, the right graph shows the intensity profile in the deconvoluted confocal image (grey plot) and the STORM image (black plot) across the green line indicated on both images. The diameter of the neural process at the measured locations is on average 63 nm (FWHM) in STORM and 250 nm (FWHM) in confocal. (C) A zoomed-in view showing 2D maximum intensity projection of neural processes imaged by confocal (left), confocal after deconvolution (middle) and STORM (right). Two neural processes in close proximity are resolved in the STORM image but are not as clearly resolved in the confocal image. (D) The graphs show the intensity profile plotted across the red line shown in (C) for the confocal image after deconvolution (grey plot) and the STORM image (black dotted plot). Two peaks are visible in the STORM plot indicating the two distinct neural processes in the STORM image. (E) xy cross-section of a 100 nm thick slice of a small neural process taken from the midpoint image of a confocal (left) and STORM (right) stack. The middle panel shows the confocal slice after deconvolution. The membrane boundaries contain more labels and are clearly evident in the STORM slice. (F) Intensity profile across the cyan line shown in (E) for the confocal image after deconvolution (grey plot) and the STORM (black plot) image. The two membrane boundaries appear as two well-separated peaks in the STORM plot. (G) Vertical cross-section images across the three yellow lines shown in (E) for the confocal image after deconvolution and the STORM image. The STORM cross-sections look hollow in the middle, as expected for membrane labeling.

