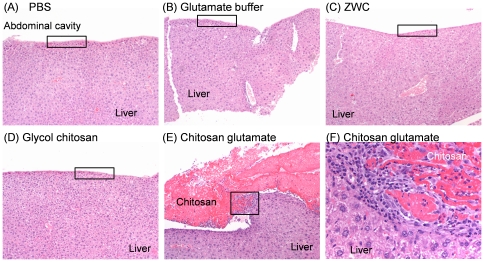
Figure 3. Hematoxylin and eosin staining of liver sections of different treatment groups.
(A) PBS (100x); (B) Glutamate buffer (100x); (C) ZWC (100x); (D) Glycol chitosan (100x). (A-D) Normal capsular surface (box). (E) Chitosan glutamate (100x): capsular surface of liver markedly thickened with precipitates of chitosan, which are surrounded by chronic inflammation and mild fibrosis (box). (F) Chitosan glutamate (400x): precipitates of chitosan on the liver surface surrounded by macrophages, fibroblasts, and neutrophils.

