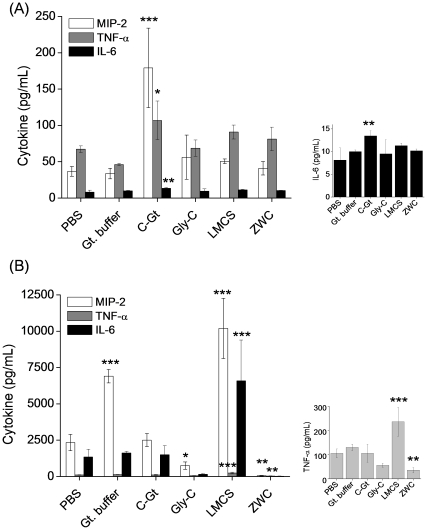
Figure 6. Effect of chitosan treatment (all in 2 mg/mL) on the levels of proinflammatory cytokines released from (A) naïve mouse peritoneal macrophages and (B) LPS-challenged macrophages.
Cytokine levels are determined by Milliplex Multi-Analyte Profiling cytokine/chemokine panel. Media of the LPS-challenged macrophages were 10 times diluted prior to analysis. Graphs on the right are displayed in narrow y-scales. ZWC (An/Am = 0.7); C-Gt: chitosan glutamate; Gly-C: glycol chitosan. Data are expressed as averages with standard deviations of three repeated measurements. *: p<0.05; **: p<0.01; ***: p<0.001 vs PBS.

