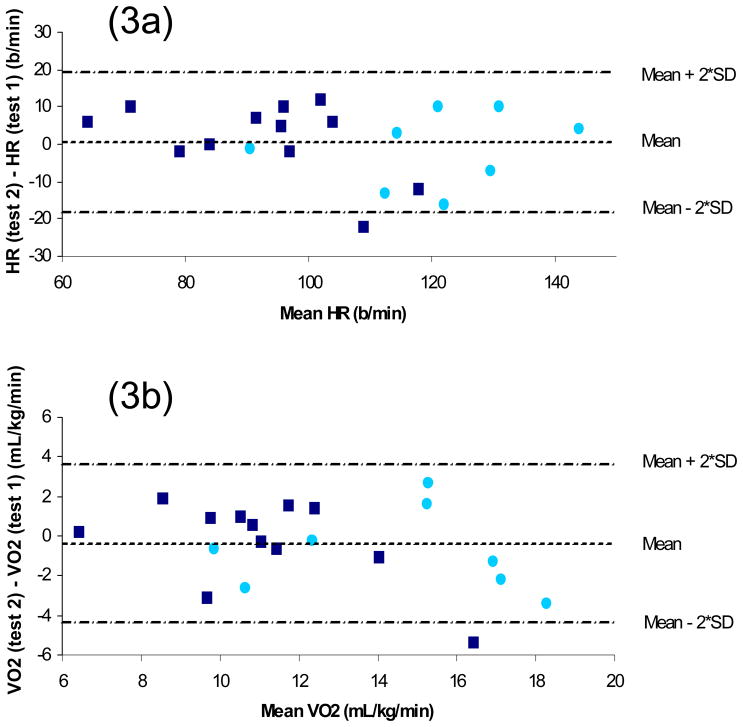
Figure 3.
Figure 3a Bland Altman plot of difference in 6-MAT HR between time 1 and time 2 versus average HR from time 1 and time 2; 3b Bland Altman plot of difference in 6-MAT VO2 between time 1 and time 2 versus average VO2 from time 1 and time 2 (light circle, subjects with paraplegia; dark square, subjects with tetraplegia)

