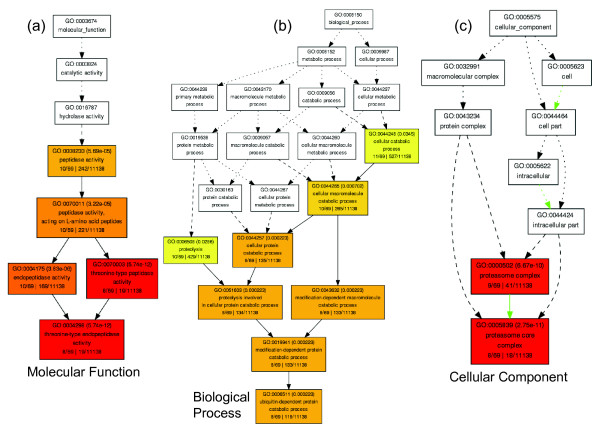
Figure 4.
Hierarchical tree graphs of over-represented GO terms for genes in the CyanWGCNA module. Hierarchical tree graphs of over-represented gene ontology (GO) terms for genes in the Cyan WGCNA module were constructed using AgriGO [16]. Boxes in the graphs represent GO terms labelled by GO number, term definition and statistical information. Significant terms (adjusted P ≤ 0.05) are coloured. The degree of colour saturation of a box is positively correlated to the enrichment level of the term. Solid, dashed, and dotted lines represent two, one and zero enriched terms at both ends connected by the line. GO categories: (a) Molecular Function; (b) Biological Process; (c) Cellular Component.

