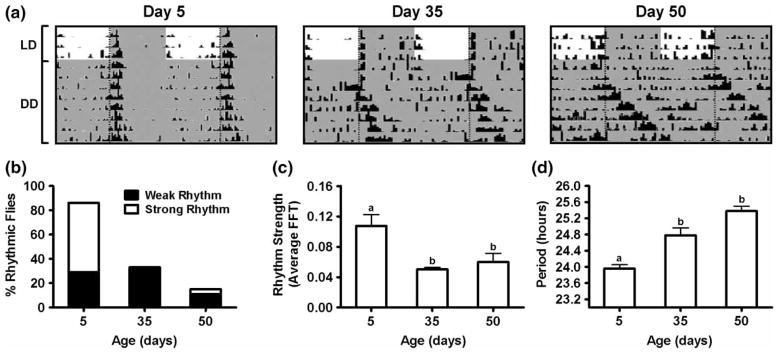
FIGURE 1.
(A) Locomotor activity profiles of representative 5-, 35-, and 50-day-old CS males. Flies of each age were monitored in LD (12:12) for 3 d, followed by 7 d in DD at 25°C. Shaded areas represent periods of darkness. Vertical dotted lines indicate time of lights-off (ZT/CT 12). (B) Percentage of rhythmic flies on days 5, 35, and 50. Flies with FFT values >.08 were considered strongly rhythmic, whereas flies with FFT values .04–.08 were classified as weakly rhythmic. (C) Average rhythm strength on days 5, 35, and 50. Values are mean ± SEM (n = 14 for day 5, n = 27 for day 35, and n = 28 for day 50). Statistical significance was determined using one-way ANOVA with Tukey’s post hoc test, and bars with different letters are significantly different (days 5 vs. 35, p < .01; 5 vs. 50, p < .01; 35 vs. 50, p > .05). (D) Average free-running period of locomotor activity on days 5, 35, and 50. Values are mean ± SEM (n = 14 for day 5, n = 27 for day 35, and n = 28 for day 50). Statistical significance was determined using one-way ANOVA with Tukey’s post hoc test, and bars with different letters are significantly different (days 5 vs. 35, p < .001; 5 vs. 50, p < .001; 35 vs. 50, p > .05).

