
FIGURE 3.
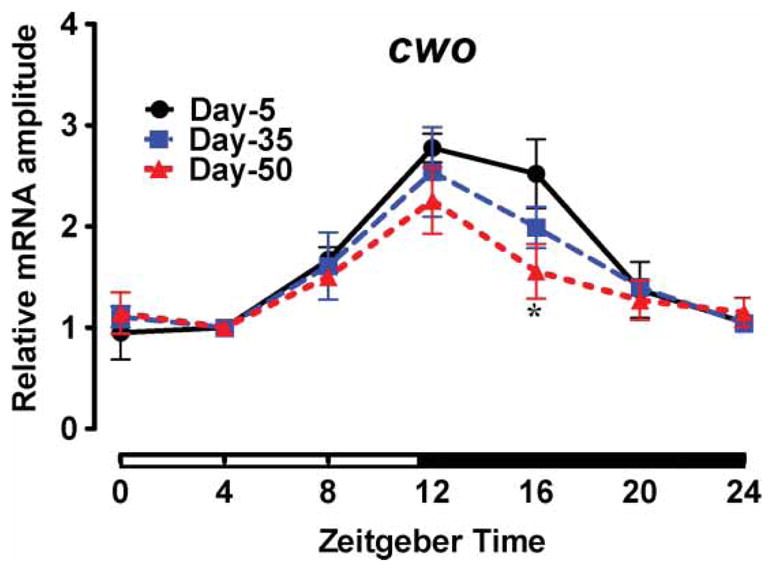
Daily mRNA profiles of cwo in the heads of 5-, 35-, and 50-day-old CS males, normalized to the trough (ZT 4) values set at 1 for each age. Each data point represents mean ± SEM for three independent RNA samples. Statistical significance between day 5 vs. 35 and day 5 vs. 50 values was determined using two-way ANOVA with Bonferonni’s post hoc test, and is denoted by *p < .05.