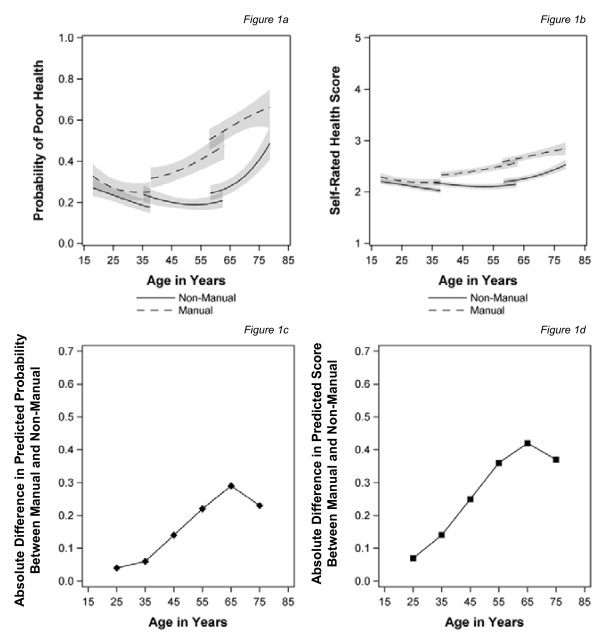
Figure 1.
Trajectories of self-assessed health and the predicted health gap by age for those in manual and non-manual classes at baseline (a) Probability of poor health (b) Self rated health score(c) Absolute difference in predicted probability between manual and non-manual (d) Absolute difference in predicted score between manual and non-manual.

