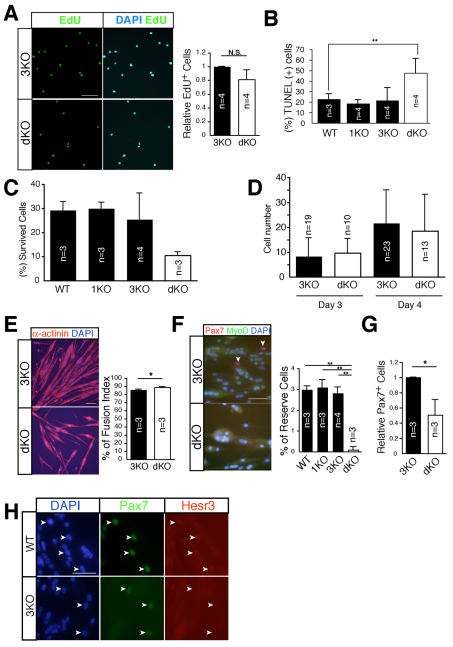
Fig. 5.
Hesr1 and Hesr3 influence the generation of reserve cells. (A) EdU (green) uptake of primary myoblasts derived from dKO or littermate 3KO mice. Nuclei were stained with DAPI (blue). The y-axis shows the mean value with s.d. (n=4). (B) Freshly isolated satellite cells were cultured in GM for 24 hours and then TUNEL staining was performed. The y-axis shows the mean value of TUNEL+ cells with s.d. (n=3-4). (C) Clonal analysis of satellite cells derived from WT, 1KO, 3KO and dKO mice, showing the frequency of colony-forming cells after 7 days in culture. (D) Cell number in colonies derived from single satellite cells cultured for 3 or 4 days. Colony number is shown in each bar. (E) Fusion index of primary myoblasts derived from dKO and littermate 3KO mice. Myotubes were stained with anti-sarcomeric α-actinin antibody (red) and DAPI (blue). The bar chart shows the mean percentage of the fusion index with s.d. (n=3). (F) Reserve cell frequencies of primary myoblasts derived from WT, 1KO, 3KO and dKO mice. The cells were stained with anti-Pax7 (red), anti-MyoD (green) and with DAPI (blue). Arrowheads indicate Pax7+ MyoD– mononuclear reserve cells. The bar chart shows the mean percentage of reserve cells with s.d. (n=3-4). (G) Relative number of Pax7-expressing cells derived from 3KO and dKO mice in differentiation medium (DM) for 1.5-2 days. The y-axis shows the mean value with s.d. (n=3). Six- to 13-week-old mice were used in these experiments. (H) The cells were cultured in DM for 3 days and stained with anti-Pax7 (green), anti-Hesr3 (red) and DAPI (blue). Arrowheads indicate Pax7+ mononuclear cells. *, P<0.05; **, P<0.01. Scale bars: 100 μm in E; 50 μm in A,F,H.

