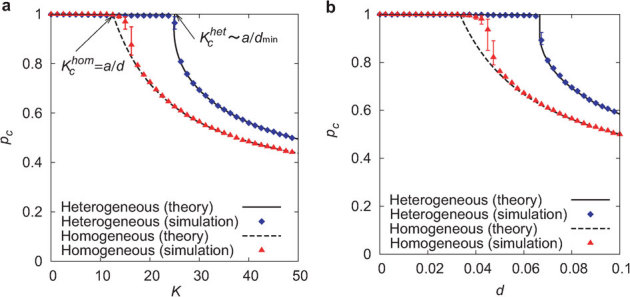
Figure 3. Comparison of the critical ratio with respect to coupling strength K and link density d between heterogeneous and homogeneous networks for random inactivation.

(a) The critical ratio pc is plotted against the coupling strength K in networks with d ∼ 0.08 (N = 3000 and 〈k〉 = 240). A globally oscillatory state with |Z| > 0 is observed for p < pc, whereas a quiescent state with |Z| = 0 is observed for p > pc. The solid and dashed black curves indicate the analytically obtained results in equations (1) and (2), respectively. Blue diamonds and red triangles indicate the numerically obtained results. The error bars indicate the variance for 10 network realizations. (b) The critical ratio pc is plotted against the link density d in networks with N = 3000 and K = 30.
