
Figure 5. Comparison of the critical ratio with respect to coupling strength K and link density d between random and targeted inactivation in heterogeneous networks.
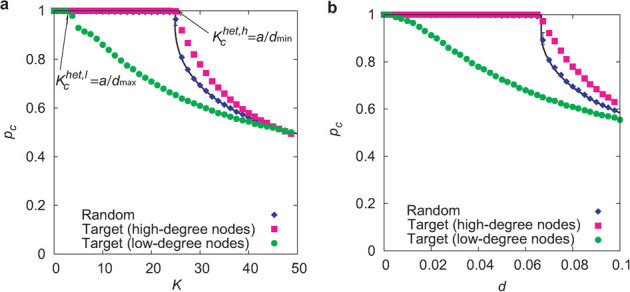
(a) The critical ratio pc is plotted against the coupling strength K in heterogeneous networks with d ∼ 0.08 (N = 3000 and 〈k〉 = 240), dmax ∼ 0.3, and dmin ∼ 0.04. Blue diamonds and the black solid curve indicate the numerically and theoretically obtained critical ratios for random inactivation, respectively. Green circles and pink squares indicate the critical ratios for the targeted inactivation of low-degree and high-degree nodes, respectively. The critical coupling strength is given by  for the former case and
  for the latter case, as theoretically predicted. (b) The critical ratio pc is plotted against the link density d in heterogeneous networks with N = 3000 and K = 30.