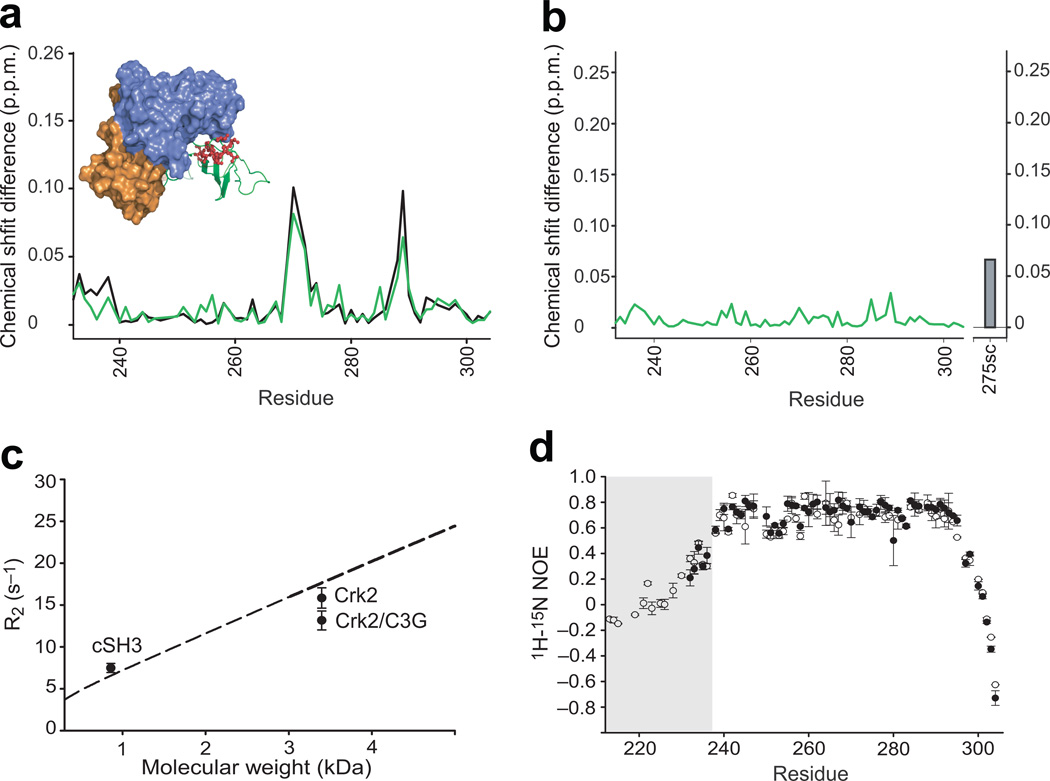
Figure 3. Structural and dynamic analysis of the cSH3 domain within Crk-II.
(a) Chemical shift differences (Δδ) of the cSH3 domain in Crk-II (black), and C3G-ligand bound Crk-II (green), relative to the isolated cSH3 domain. The inset shows the locations of the residues whose resonances changed markedly between isolated cSH3 and Crk-II (top 25% in the deviation plot). (b) Chemical shift differences of the cSH3 domain in C3G-ligand bound Crk-II, compared to those within Crk-II. The difference for the 15Nε1 resonance of Trp275 is shown as a bar. (c) Comparison of average R2 rates of the cSH3 domain in isolation (Mw=8,569 Da), in Crk-II, and in Crk-II/C3G (~33,830 Da). The dashed line represents the molecular weight dependent R2 rates calculated using isotropic rotational correlation times calculated from Stokes’ law. Error bars represent the standard deviation of average R2. (d) {1H}-15N heteronuclear NOE measurements for the cSH3 domain in isolation, residues 232–304, (closed circles) and within Crk-II, residues 208–304, (open circles). The residues corresponding to the linker region, residues 208–236, are shaded in the plot. Error bars represent the propagated uncertainties of two repeated experiments. The uncertainty was estimated using background noise of the spectrum.

