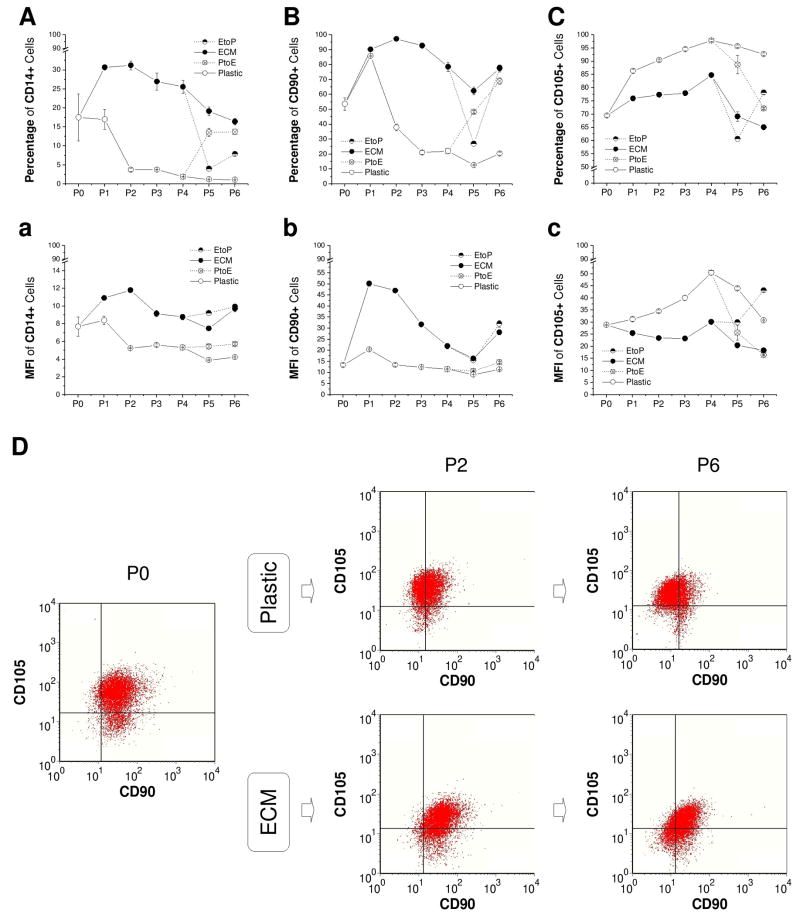
Fig. 2.
Immunophenotype changes of chondrocytes expanded on ECM, Plastic, PtoE, or EtoP from P0 to P6. Flow cytometry was used to evaluate the percentage (A - C) and mean fluorescence intensity (MFI, a - c) of CD14+, CD90+, and CD105+ chondrocytes during cell expansion. Dual positive chondrocytes of CD90+ and CD105+ were represented at P0, P2, and P6 (D). Data are shown as average ± SD for n = 3.

