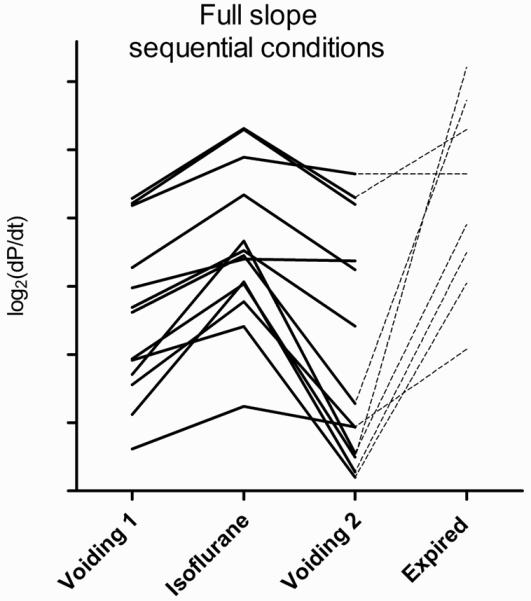
Figure 2.

Sequential full slope (ΔP/Δt) values for each of 15 mice. Slopes expressed as log2(ΔP/Δt) used to clarify graphical representation. All isoflurane slopes are greater than pre- and post-isoflurane slopes. Dotted lines connect to post-euthanasia slopes, urethane group only.
