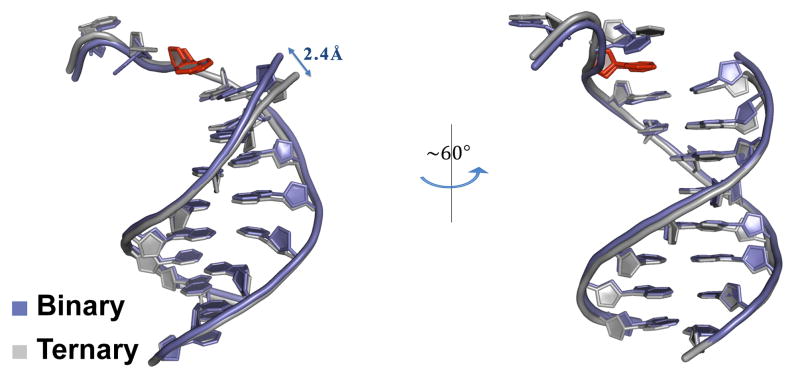
Fig. 5.
Comparison of the DNA template and primer strands in the human Polη binary and ternary complexes. The two complexes are again superimposed based on the hPolη palm domain. The DNA is shown in blue and gray in the binary and ternary complexes, respectively. The templating base is shown in red in both binary and ternary template strands in both the complexes. The view on the right is obtained by ~60° rotation along the DNA axis.

