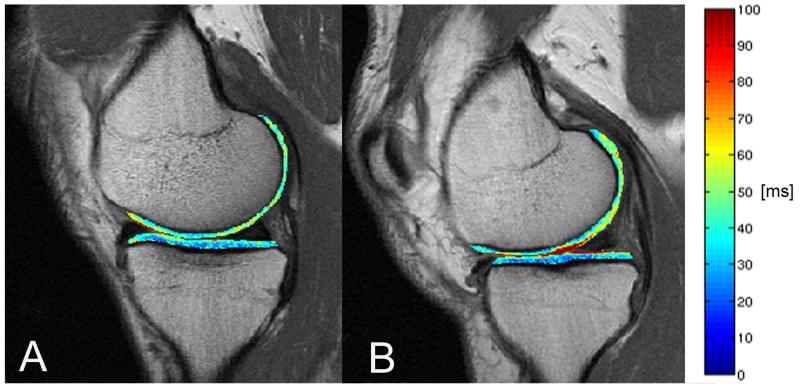
Figure 2.
T2 color maps of the medial femur and medial tibia compartments of the right knee overlaid with the first-echo images of MSME sequence. (A) Representative subject without cartilage lesion and (B) representative subject with cartilage lesion. Blue color indicates low, red color high cartilage T2 values. High cartilage T2 values are associated with increased water content and deterioration of the collagen network. The subject with cartilage lesion showed elevated T2 values compared to the subject without cartilage lesion.

