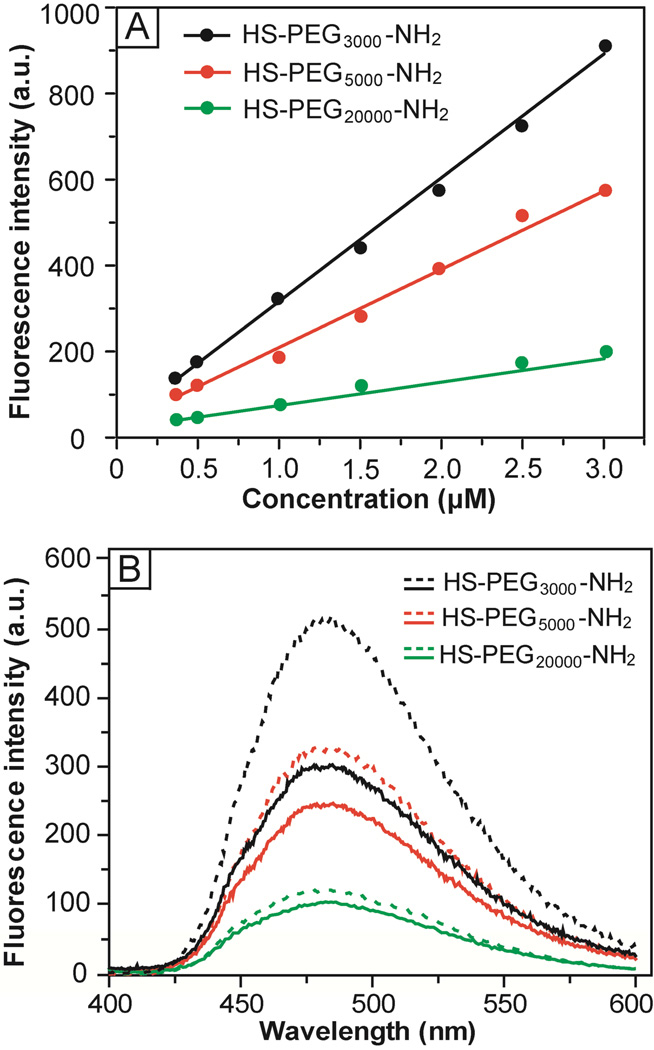
Figure 4.
(A) Calibration curves for HS-PEG-NH2 and fluorescamine-based assay at pH = 10, showing a linear relationship between the fluorescence intensity at 480 nm and the concentration of HS-PEG-NH2. (B) Fluorescence spectra corresponding to the chromophore derived from a reaction between fluorescamine and HS-PEG3000-NH2 (black curves), HS-PEG5000-NH2 (red curves), and HS-PEG20000-NH2 (green curves), respectively. The doted and solid curves correspond to the spectra taken from the original solution and the supernatant after incubation with 50-nm AuNCs for 12 h, respectively.

