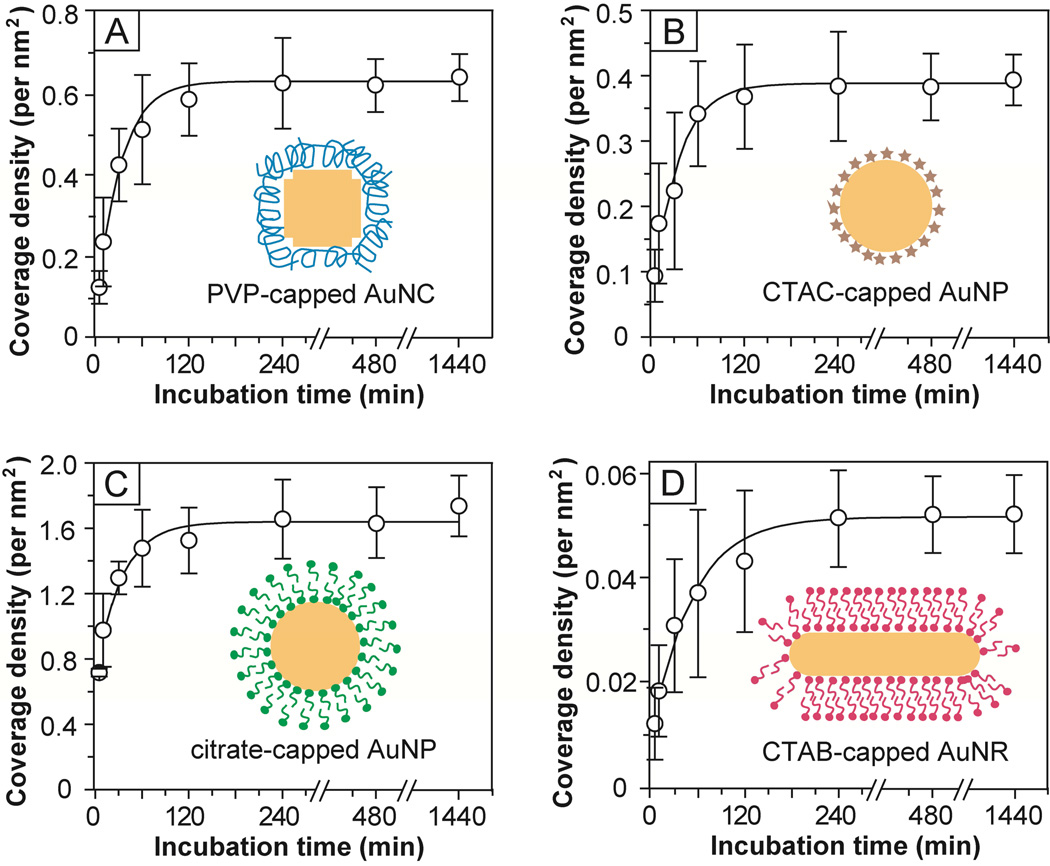
Figure 7.
Adsorption kinetics for the PEGylation of various types of Au nanostructures with HS-PEG5000-NH2 as measured by the fluorescamine-based assay. The error bars represent standard deviation from six replicas for each measurement. The inset depicts the morphology of each type of Au nanostructure and its surface capping layer.

