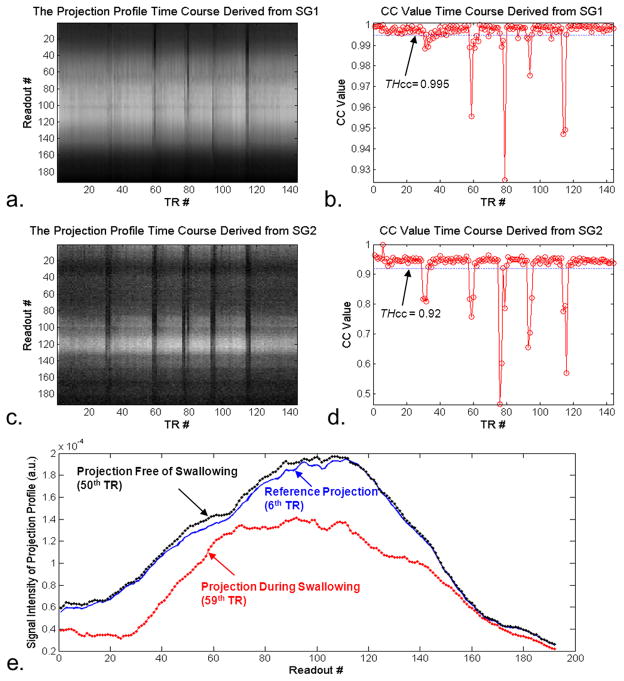
Fig. 3.
Processing of the SG signals from a “SPACE SWL+SG” scan in a healthy volunteer illustrates how the SG method detects swallowing motion. The time courses of projection profiles (a. and c.) and cross-correlation coefficients (CC) (b. and d.) obtained from SG1 and SG2, respectively, clearly demonstrates that instructed swallowing events are always detected by either or both of the two SG signals. In contrast to the projection profiles devoid of motion, motion-contaminated projection profiles deviate substantially in shape and magnitude from the reference projection profile (e.).

