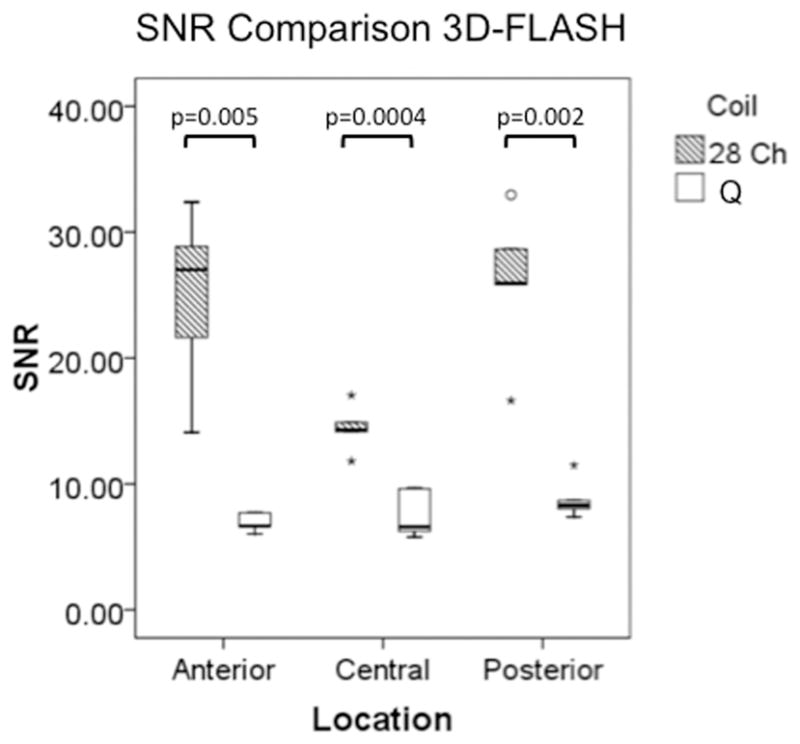
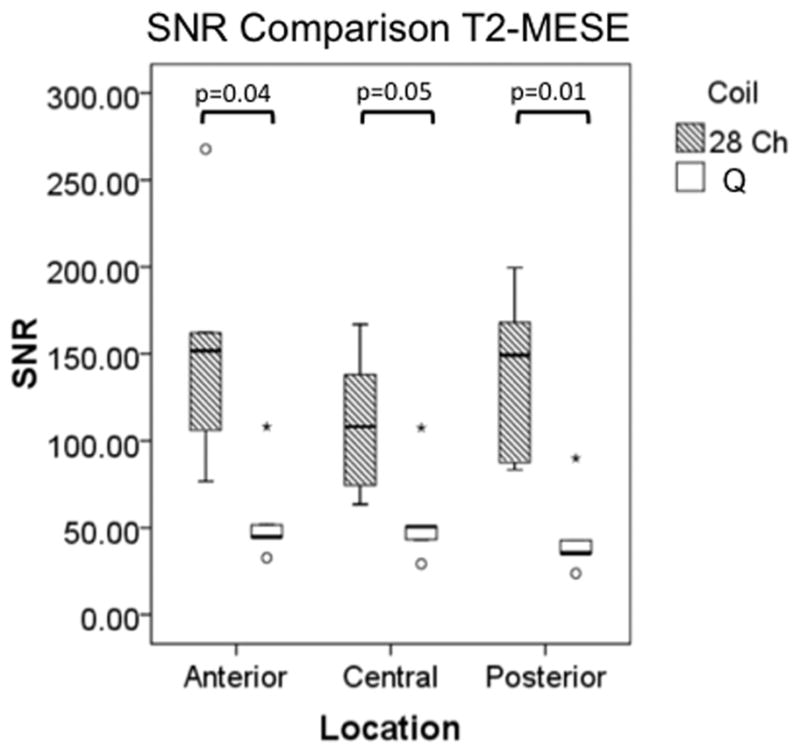
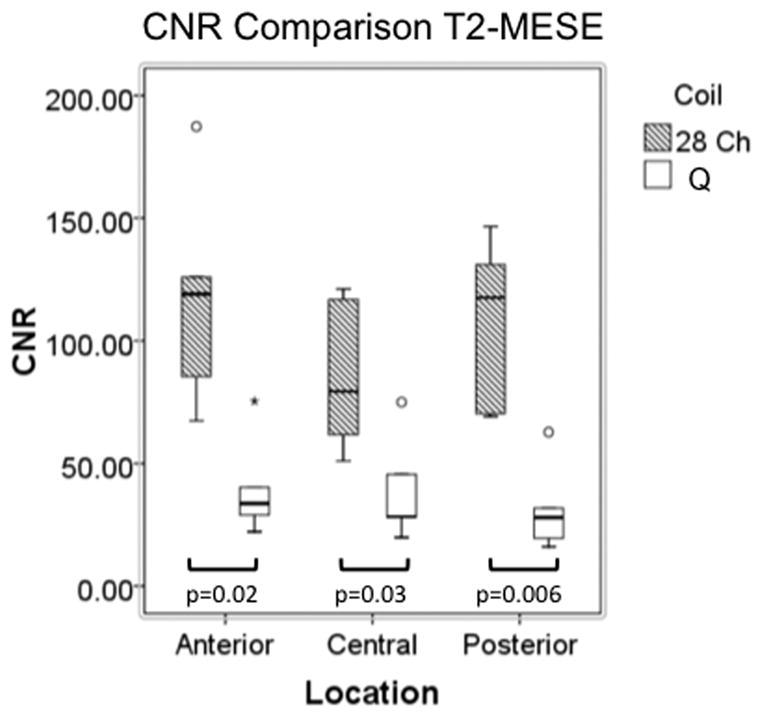
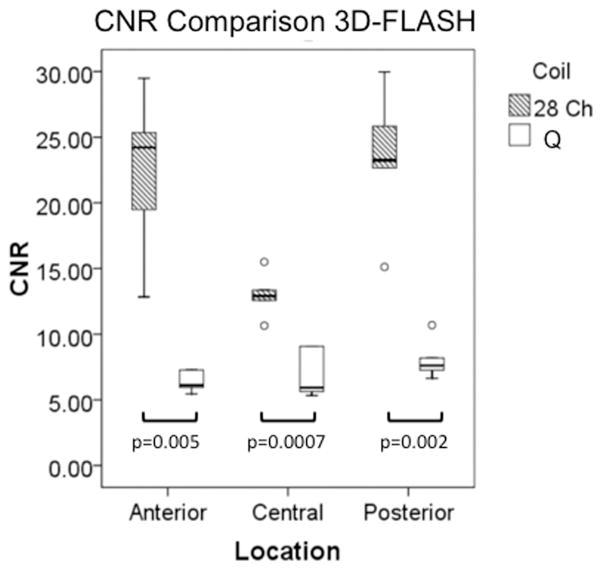
Figure 3.


(a–d). Boxplots comparing SNR and CNR with adjacent subchondral bone in the anterior, central, and posterior locations for the 28 channel (28 Ch) coil and the quadrature (Q) coil for both the 3D-FLASH and the T2 multi-echo spin-echo (T2-MESE) sequence. For the T2-MESE sequence, the earliest TE was used to calculate SNR and CNR. For the 3D-FLASH sequence and for the T2-MESE sequence, SNR (a, c) and CNR (b, d) were greater in the 28 channel coil compared to the quadrature coil (p ≤ 0.05 for all).

