Figure 4.


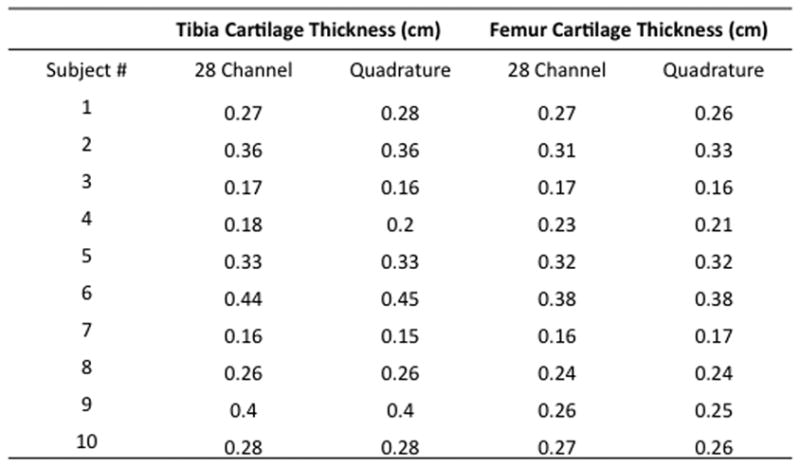
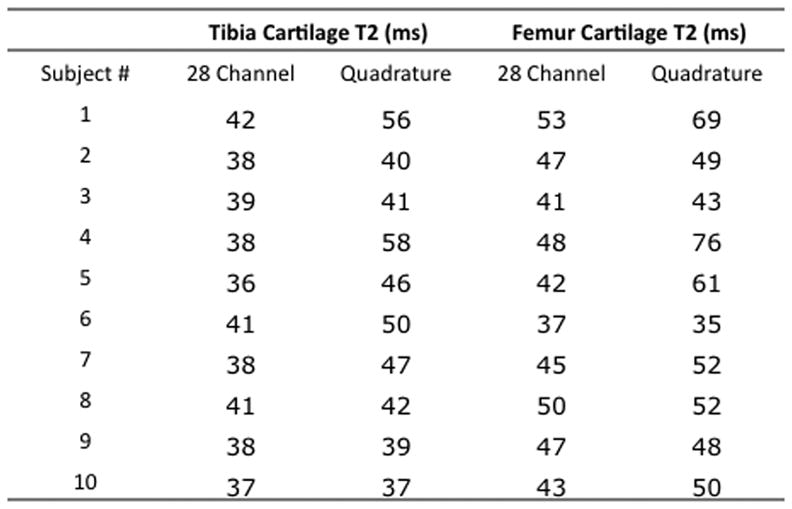
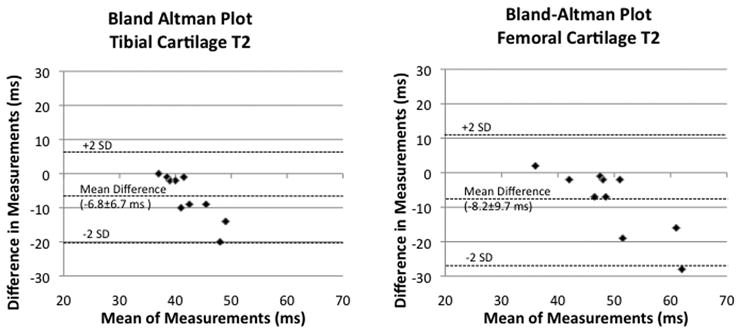
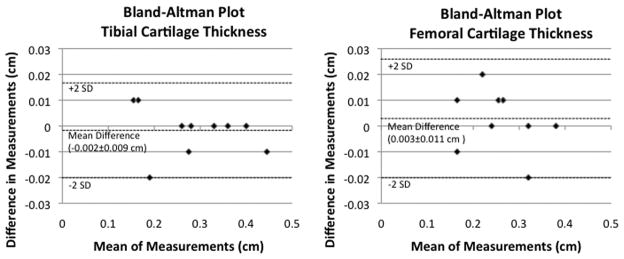
(a–d). (a) Tibial and femoral cartilage thickness measurements (cm) obtained with the 28 channel and quadrature coil for all subjects. (b) Bland-Altman plots show small differences in measurements of cartilage thickness made with the 28 channel coil and quadrature coil. (c) Tibial and femoral cartilage T2 values (ms) obtained with the 28 channel and quadrature coil for all subjects. (d) Bland-Altman plots show large differences in measurements of cartilage T2 values made with the 28 channel and quadrature coil.

