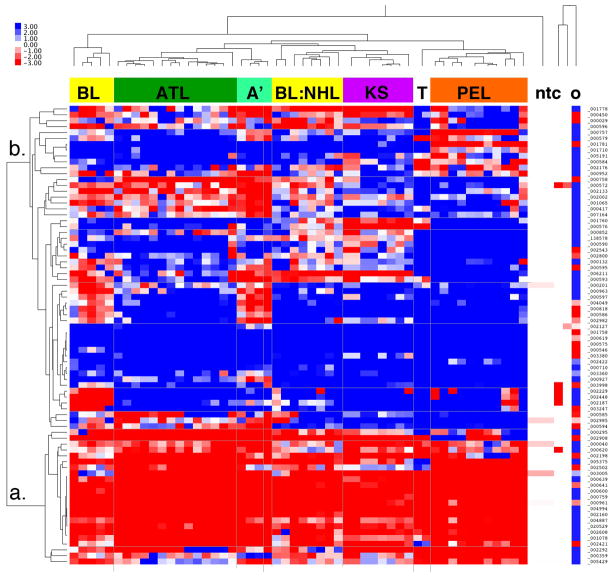
Figure 1.
A. Heatmap representation of unsupervised clustering of all study data. Normalized (dCT) and median-centered relative mRNA levels were clustered by gene and by sample. “Blue” indicates reduction and “Red” indicates induction relative to the median for each sample. “a.” and “b.” indicate the two main clusters of mRNAs. The clusters of samples matched their presumptive origin: BL, Burkitt lymphoma; ATL, Adult T cell leukemia, A’: a novel sub-type of ATL; BL:NHL, a novel subtype of BL, which clustered with non-BL NHL samples; KS, Kaposi sarcomabiopsies, T: KS-like cell lines; PEL, primary effusion lymphoma; ntc, non-template control,; o, outlier ATL sample. Relative scale is indicated on the top left(The data points for the ntc appear white in figure 1A since the normalized data were median-centered by sample).

