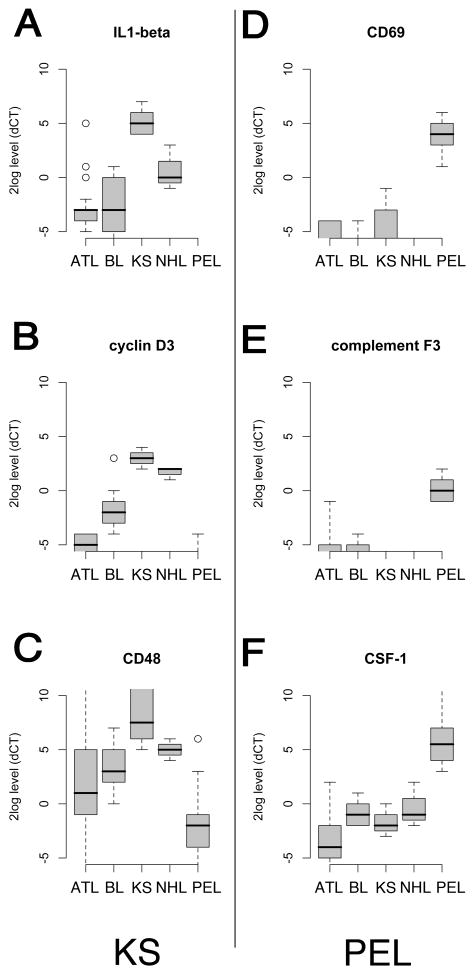
Figure 2.
Supervised class comparison of study data represented as Box plots. The box covers the 25 to 75 percentile of the data, i.e. the inter quartile range (IQR). The horizontal line indicates the median. Whiskers demarcate the minimum and maximum of the data. Open circles denote outliers (1.5 * IQR from the 1st and 3rd quartiles). A, B, C; shown are the top most discriminating mRNAs that distinguish KSHV-associated KS from AIDS-associated lymphoma. D, E, F; shown are the top most discriminating mRNAs that distinguish PEL from AIDS-associated lymphoma and ATL. For these markers p < 0.001 after adjustment for false discovery rate. Relative levels on a log10 scale for the indicated mRNAs are shown on the vertical and classes on the horizontal axis.

