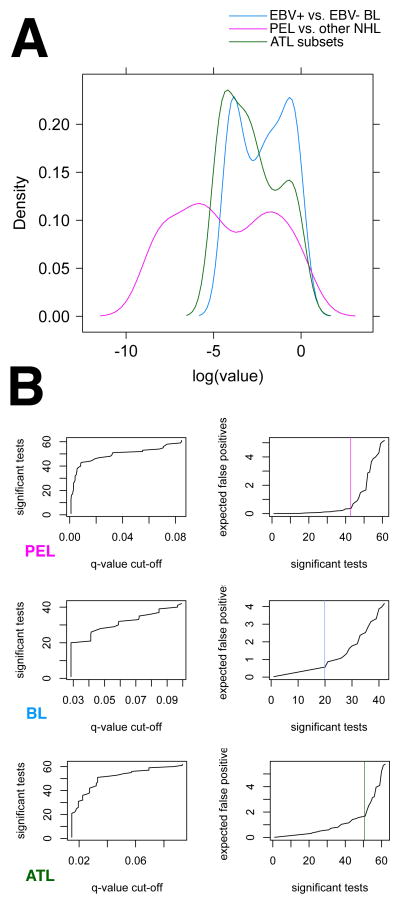
Figure 3.
Tree-based classification of PEL, BL subsets and ATL subsets. (A) Density plot of p values for each individual mRNA in the array that result from two-sample non-parametric comparison of PEL to all other lymphomas (PEL, purple), the two subsets of BL (BL, blue) and the two subsets of ATL (ATL, green). (B) Corresponding all other NHL diagnostic plots for q-value calculation. For each comparison the left panel plots the number of significant tests, i.e. genes at a given q-value cut-off level. Note that for PEL ~ 40 genes were significant to q≤ 0.02, for BL and ATL subsets only ~ 20. For each comparison the right panel plots the expected number of false positive markers among the top most significant tests on the vertical and the number of significant tests on the horizontal axis. Note that for PEL < 1 false positive is expected within the top 40 most differentially regulated genes, for BL subsets 3–4 false positives are expected and for ATL subsets also < 1.

