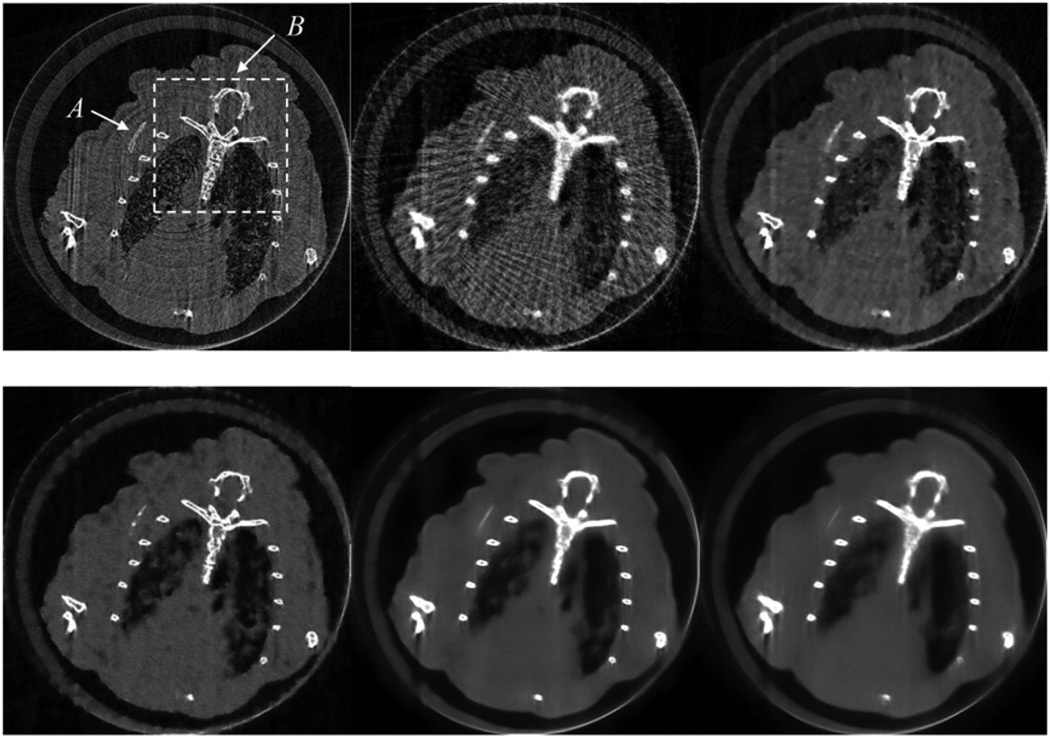
Figure 9.
Top row: from left to right are the results obtained using SART from 575 projections, SART from 46 projections and SART–TV from 46 projections. Bottom row: from left to right are the results obtained using the proposed method from 46 projections with patch sizes 9 × 9, 17 × 17, and 36 × 36.

