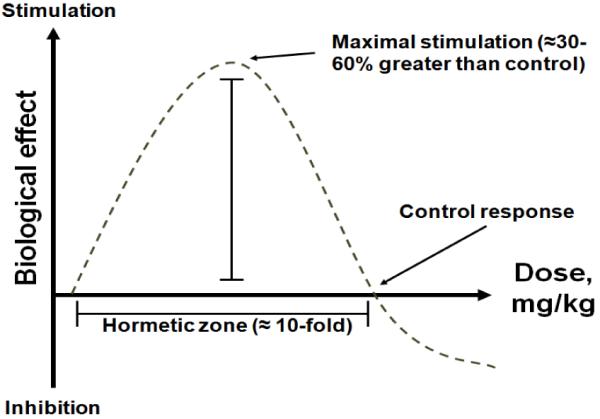
Figure 2. Inverted U-shaped curve typical of hormesis.

Increasing doses induce stimulatory or beneficial effects. Maximal stimulation is seen at intermediate doses and corresponds to 30-60% increases compared to control, as opposed to several fold-increases typical of linear-non-threshold dose-response curves. As the dose increases, the biological response becomes less stimulatory and can be no different than control. With even higher doses, inhibitory or toxic effects are observed. This hormetic dose-response is also called the β curve. Behavioral and neurochemical hormetic effects of methylene blue have been described in vivo (Bruchey and Gonzalez-Lima, 2008).
