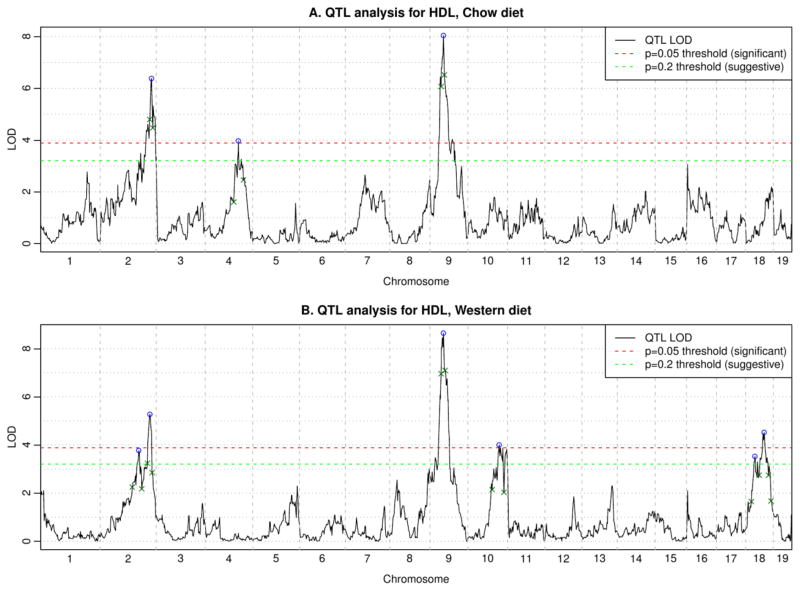
Figure 2. QTL analysis for HDL.
Here we combined male and female mice together and treated sex as a covariate. Graphs show the LOD scores as well as significant (p=0.05) and suggestive (p=0.20) thresholds. Peaks are indicated by blue circles; small green crosses indicate boundaries of peak regions (LOD drop of 1.5 from the peak).

