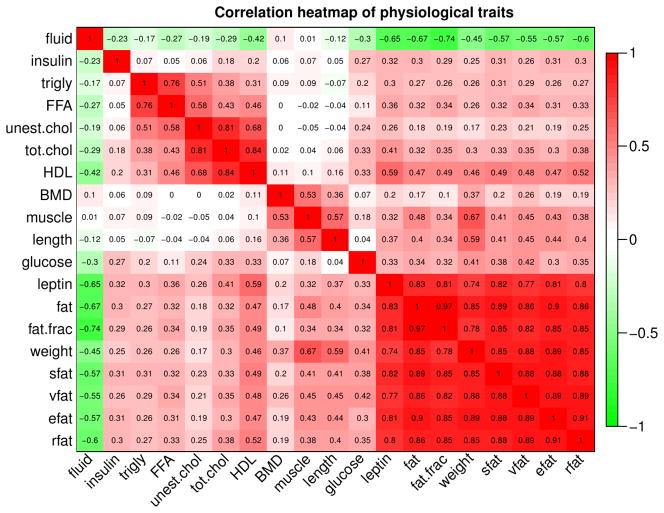
Figure 4. Correlation heatmap of physiological traits measured in the CASTxB6 cross.
Statistical association, as measured by robust correlation, of physiological traits in female mice of the CASTxB6 cross. Each row and each column corresponds to a trait. Numbers within the table represent robust correlations. Cells in the table are color coded using correlation values according to color scale on the right, that is high positive correlations are denoted by strong red color, and high negative correlations by strong green color.

