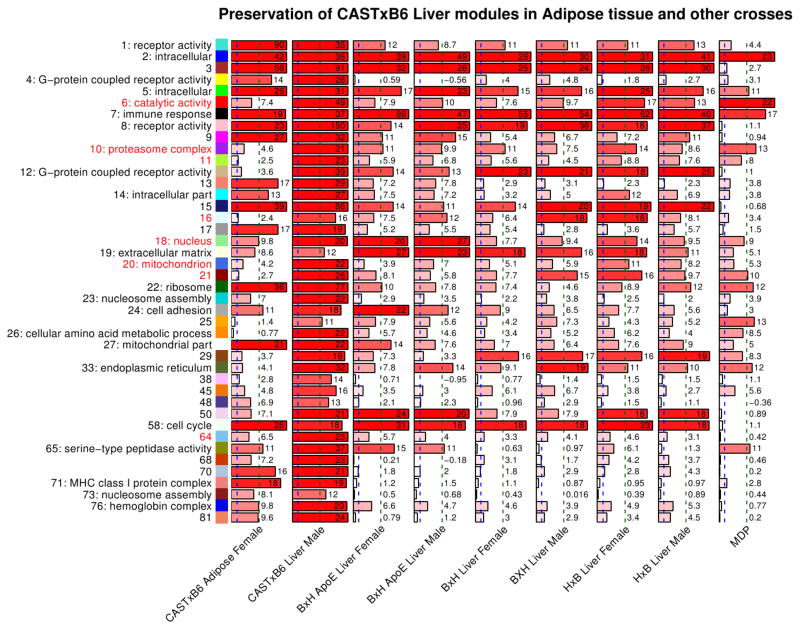
Figure 6. Preservation of CASTxB6 female liver modules in the corresponding adipose female, liver male, and other crosses expression data.
Each column represents a single barplot and corresponds to a test set indicated below each column. Each row corresponds to a CASTxB6 female liver module. The modules are indicated on the left side by module color, module number, and the most significant GO annotation. The barplots represent the summary preservation statistics Zsummary for the corresponding module in the test data sets. The scores are also indicated by the numbers next to the bars. The blue and green vertical dashed lines indicate the thresholds Zsummary=2 and 10 for weak and strong evidence of preservation, respectively.

