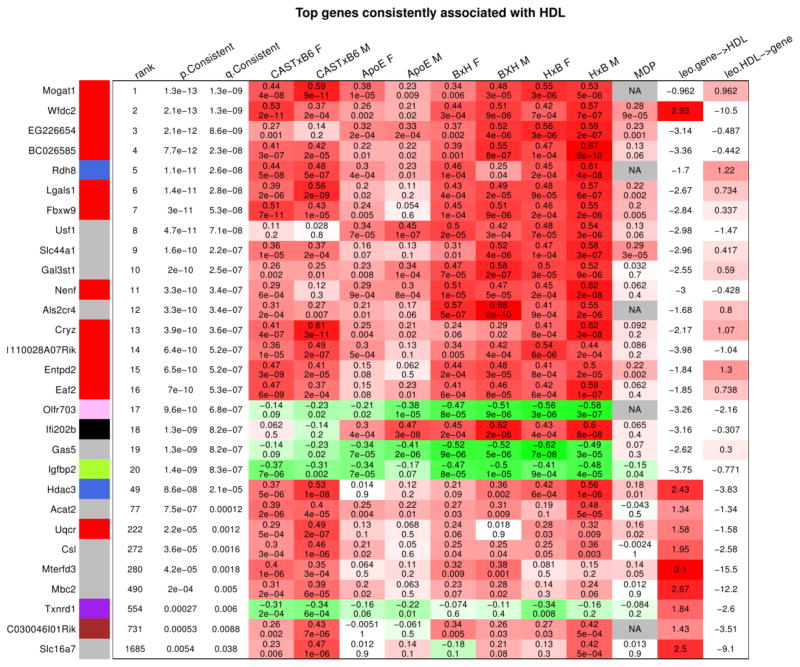
Figure 8. Top genes consistently associated with HDL across all studied data sets.
Each row corresponds to one gene indicated on the left. The color indicator next to the gene symbol indicates module membership (grey corresponds to genes not assigned to any of the modules). The first two columns give the p- and q-value (local FDR) for the null hypothesis of no consistent association. The following columns show the association (as measured by robust correlation) and the corresponding p-value of the gene and HDL in each of our data sets. The table shows the 20 genes with most significant p-value for consistent association with HDL. We note that 12 of the top 20 genes belong to module 6 (red color)

