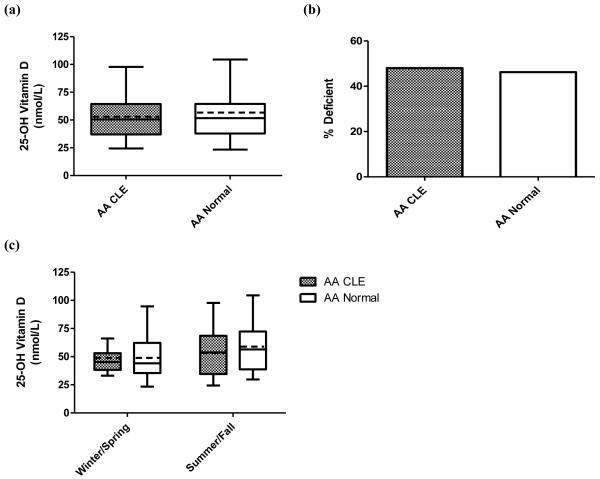
Fig. 1.
25-OH vitamin D levels in African American (AA) CLE subjects and normal controls. (a) Mean 25-OH vitamin D levels among AA CLE (N=25) and normal controls (N=26). The boxes contain results between the 25th and 75th percentile, with the dark lines in the boxes representing the median (AA CLE=50.6 nmol/L, AA normal=51.7 nmol/L) and the dashed lines in the boxes representing the mean (AA CLE=52.0 nmol/L, AA normal=54.8 nmol/L). Traditional Tukey whiskers were used for each group. (b) Prevalence of vitamin D insufficiency in AA CLE (N=25) and normal controls (N=26). Vitamin D insufficiency is defined as less than 50 nmol/L. (c) Mean 25-OH vitamin D levels by season among AA CLE and normal controls. Winter/spring draws were obtained from CLE (N=12) and normal controls (N=12) from November to April. CLE (N=13) and normal controls (N=14) underwent summer/fall draws from May to October. The boxes contain results between the 25th and 75th percentile, with the dark lines in the boxes representing the median (AA CLE: winter/spring=45.3 nmol/L, summer/fall=53.8 nmol/L; AA normal: winter/spring=44.1 nmol/L, summer/fall=56.4 nmol/L) and the dashed lines in the boxes representing the mean (AA CLE: winter/spring=48.8 nmol/L, summer/fall=54.9 nmol/L; AA normal: winter/spring=49.6 nmol/L, summer/fall=59.2 nmol/L). Traditional Tukey whiskers were used for each group.

