Fig. 5.

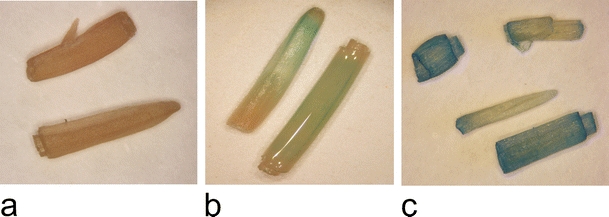
Histochemical analysis of GUS activity in the leaves of T1 plants: control, non-transgenic (a) and GUS-positive, transgenic plants (b–c)

Histochemical analysis of GUS activity in the leaves of T1 plants: control, non-transgenic (a) and GUS-positive, transgenic plants (b–c)