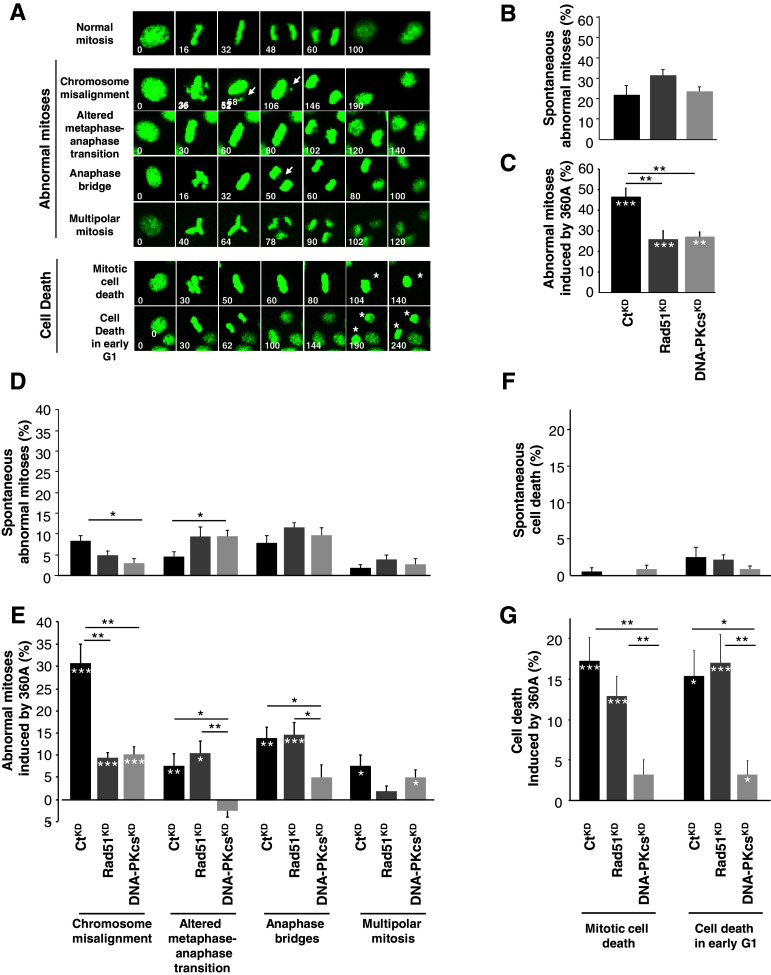
Fig. 3.
Telomeric aberrations induced by 360A are involved in mitosis impairment and cell death. a Representative time-lapse images of H2B-GFP HeLa mitosis obtained from ESM, videos 1, 2, 3, 4, 5, 6 and 7, respectively, showing a normal mitosis and examples of abnormal mitoses with chromosome misalignment (white arrow), with an altered metaphase–anaphase transition, with anaphase bridge (white arrow), or multipolar mitosis and cell undergoing a mitotic cell death (white star) or cell death in early G1 of both daughter cells after a normal mitosis (white stars). Original magnification ×20. Elapsed times are noted on each image (min). b Percentage of spontaneous abnormal mitoses in CtKD, Rad51KD and DNA-PKcsKD H2B-GFP HeLa cells. c Percentage of abnormal mitoses induced by 7 days of treatment with 5 μM of the G4-ligand 360A (bottom graph) in CtKD, Rad51KD and DNA-PKcsKD H2B-GFP HeLa cells. All percentages (±SEM) were calculated from the percentages of abnormal mitoses identified in 360A-treated-deficient cells minus the mean of abnormal mitoses found in the respective DMSO-treated deficient cells (b). A white star indicates a significant difference between DMSO- and 360A-treated cells. Percentages were obtained from approximately 200 mitoses per condition (see ESM, Table 2). d Percentage of spontaneous abnormal mitoses with the indicated mitosis abnormality in untreated CtKD, Rad51KD and DNA-PKcsKD H2B-GFP HeLa cells. e Percentage of abnormal mitoses induced by 7 days of treatment with 5 μM of the G4-ligand 360A in CtKD, Rad51KD and DNA-PKcsKD H2B-GFP HeLa cells. All percentages (±SEM) were calculated from percentages of abnormal mitoses found in 360A-treated-deficient cells minus the mean of abnormal mitoses found in the respective DMSO deficient cells. A white star indicates a significant difference between DMSO- and 360A-treated cells. The numbers of analyzed cells are indicated in ESM, Table 2. f Percentage of spontaneous cell death during mitosis or early G1 phase in CtKD, Rad51KD and DNA-PKcsKD HeLa cells treated for 7 days with 0.05% DMSO (open bars) or with 5 μM 360A (closed bars). g Percentage of cell death during mitosis or early G1 phase in CtKD, Rad51KD and DNA-PKcsKD HeLa cells treated for 7 days with 5 μM 360A. All percentages (±SEM) were calculated from the percentages of dead cells found in 360A-treated deficient cells minus the mean of dead cells found in the respective DMSO-treated deficient cells. A white star indicates a significant difference between DMSO- and 360A-treated cells. Numbers of analyzed cells are indicated in ESM, Table 2

