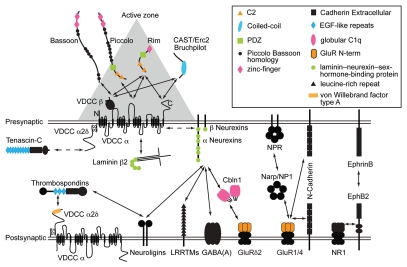
Figure 1.
A schematic diagram of a subset of synaptic channels and interacting proteins. Solid arrows represent interactions and the dotted arrows indicate a functional link. Horizontal double lines show pre- and post-synaptic membranes. The space between these double lines represents the synaptic cleft. The gray triangle depicts the electron dense material of presynaptic active zones detected by electron microscopy. Some protein domains involved in protein-protein interactions are color-coded and listed in the top right box. The size of proteins and the synaptic cleft are not in scale. Abbreviations: cerebellin 1 precursor proteins (Cbln1), GABAA receptor (GABAA), Glutamate receptor (GluR), leucine-rich repeat transmembrane neuronal proteins (LRRTMs), neuronal activity-regulated pentraxin (Narp), neuronal pentraxin1 (NP1), neuronal pentraxin receptor (NPR), NMDA receptor subunit GluN1 (NR1), voltage-dependent calcium channels (VDCC).

