
FIGURE 3.
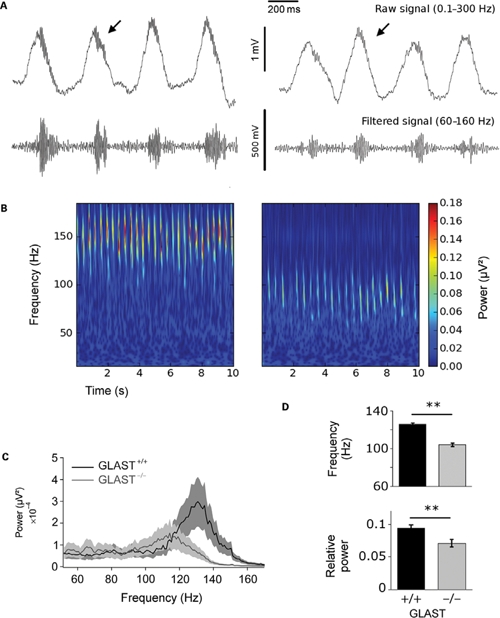
Gamma activity recorded during spontaneous activity in the olfactory bulb of GLAST+/+ and GLAST-/- mice. (A) Gamma bursts are present on each respiratory cycle, both in a GLAST+/+ mouse (left) and a GLAST-/- mouse (right) as displayed on representative local field potential recording examples. Top: raw signals 0.3–300 Hz; bottom: filtered signals 60–160 Hz. (B) Shift of gamma bursts frequency in GLAST-/- mice. The signal is represented as a time (x-axis)–frequency (y-axis) decomposition between 10 and 160 Hz. The color scale represents signal power (μV2). (C). Normalized average power spectra (60–160 Hz) during spontaneous activity in GLAST+/+ (n = 6) and GLAST-/- (n = 6) mice. Frequency and power of gamma oscillations are significantly reduced in GLAST-/- compared to controls. (D) Peaks values averaged for the population [GLAST+/+ (n = 6); GLAST-/- (n = 6)] confirm the frequency shift and power decrease in GLAST-/- animals. **p < 0.001.