
FIGURE 4.
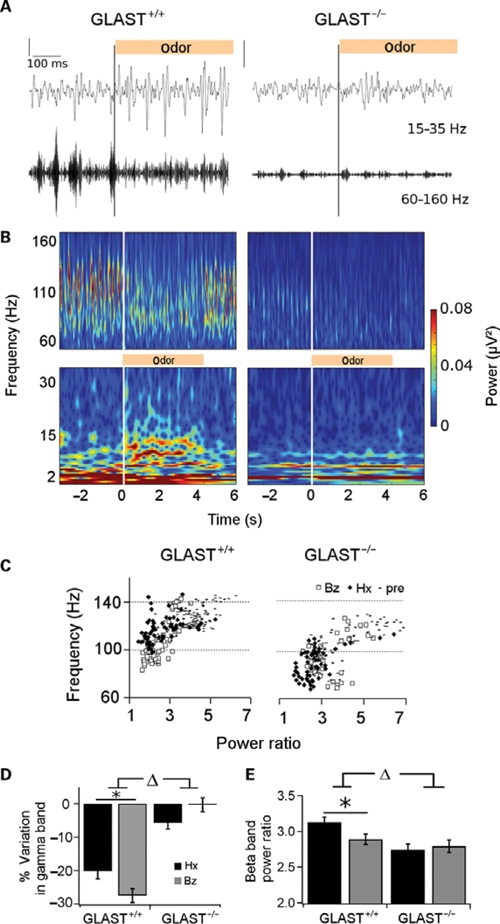
Effects of odor stimulation on beta (15–35 Hz) and gamma (60–160 Hz) oscillations in GLAST+/+ and GLAST-/- mice. (A) Representative single trial showing the switch of oscillations during odor presentation (vertical bar, hexanal 2%) in a GLAST+/+ (left column) and GLAST-/- (right column) mice.Top traces: beta (15–35 Hz) filtered; bottom traces: gamma (60–160 Hz) filtered LFPs. (B) Signal represented for one mouse from each group as a time (x-axis)–frequency (y-axis) decomposition between 2 and 35 Hz (beta band, bottom) and 60–160 Hz (gamma band, top) after processing of raw signals shown in (A). The four plots are set to the same scale for power (color bar). White vertical lines indicate odor onset. (C) Individual peaks extracted in the gamma band (60–160 Hz) during pre-odor (from –8 to –4 s; hyphen) and odor period (from 1 to 5 s) under benzaldehyde (diamonds) or hexanal (empty squares) are plotted as function of their power (x-axis) and frequency (y-axis). The frequency shift is clear for both genotypes during odor sampling even though frequency is slower in GLAST-/- mice. Peaks have a lower frequency under benzaldehyde than under hexanal in GLAST+/+, no difference in repartition is observed for GLAST-/- mice. (D) Decrease in high gamma band (60–160 Hz) power illustrated as the variation (in %) of the average power value comparing the two time–frequency plots (pre-odor from –8 to –4 s) and odor periods (1–5 s) for hexanal 2% (black bars) and benzaldehyde 2% (gray bars). No gamma decrease is observed in GLAST-/-(n = 4) compared to GLAST+/+ (n = 4) mice. (E) Values of beta peaks power for both odors (hexanal 2% in black and benzaldehyde 2% in gray bars) in GLAST+/+ and GLAST-/-. Power of the peaks is significantly lower in GLAST-/- mice.