Figure 3.
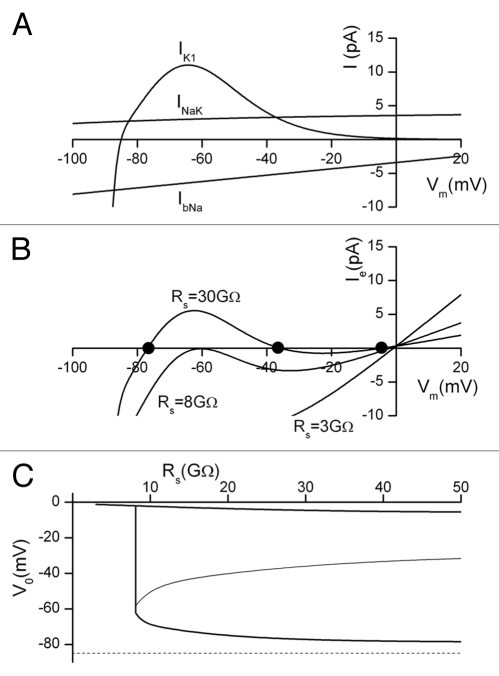
Simulation of the effect of leakage current through the patch microelectrode seal resistance in a cell which expresses a realistic combination of time independent or background currents: (i) a nonlinear K+ current, IK1, (ii) a Na+/K+ pump current, INaK and (iii) a Na+ current, IbNa. (A) shows the current-voltage relations for each of IK1, INaK and IbNa. (B) shows the patch electrode total current, Ie, as a function of membrane potential, for three different values of seal resistance Rs. Note that for Rs = 30 GΩ there are three zero-current potentials: −77, −36 and −4.5 mV (black dots). For Rs = 8 GΩ, the zero-current membrane potentials are −61 and −2.5 mV. At Rs = 3 GΩ, zero current only occurs when the membrane potential depolarizes to Vm = −1 mV. (C) shows the relationship between Vo and Rs for the three-conductance cell model in (A). For Rs ≥ 8 GΩ, the cell exhibits 3 distinct values of Vo, while for Rs < 8 GΩ, there is only one, very deoplarized value. There is a very sharp “discontinuity” in the Vo-vs.-Rs relation in the vicinity of Rs = 8 G. The dotted line represents the true value of resting potential at −85 mV.

