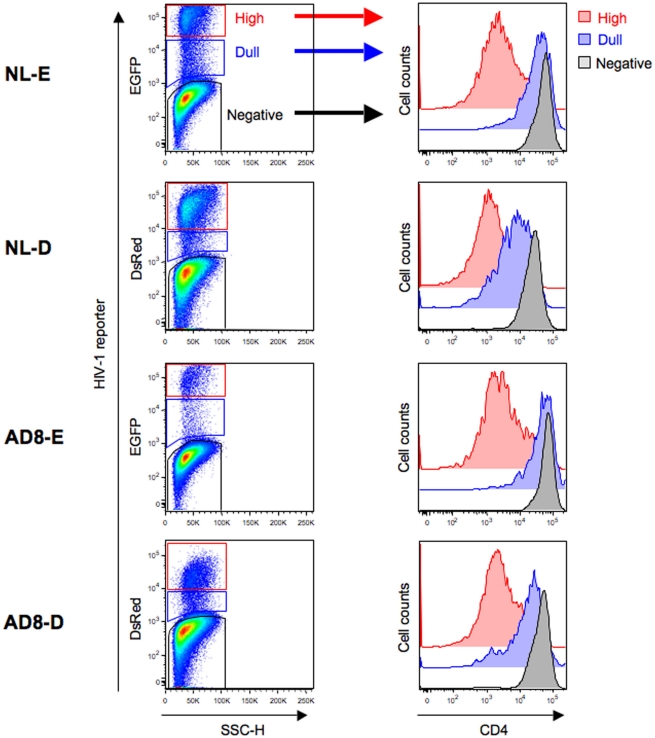
Figure 2.
Flow cytometry analysis of HIV-1-infected cells. Unstimulated CD4+ T cells were infected with HIV-1NL-E, HIV-1NL-D, HIV-1NLAD8-E, or HIV-1NLAD8-D and cultured for 5 days (including the initial 1 day culture with TCR-stimulation). (Left panels) representative pseudo-color plot profiles for the Dead−/CD3+/CD8−-gated cell fractions from three donors. Cells were classified as high (red), dull (blue), and negative (black) based on the HIV-1 reporter intensity. (Right panels) histograms of CD4 expression by the high (red), dull (blue), and negative (black) fractions defined.

