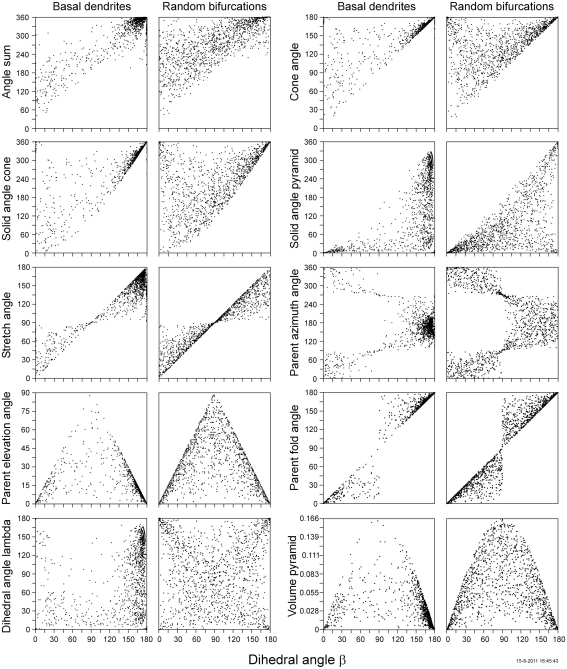
Figure 8.
Scatter plots of the various measures of flatness versus the dihedral angle β for the 1242 basal dendritic bifurcations (first and third column) and for a similar number of random bifurcations (second and fourth column). Note, that the frequency distributions of data points along the axes conform to the distributions in Figures 5 and 6 for random and basal dendritic bifurcations, respectively. The data points along the horizontal axis in the random bifurcation panels are thus uniformly distributed and in the basal dendritic bifurcation panels distributed as in Figure 6M.

