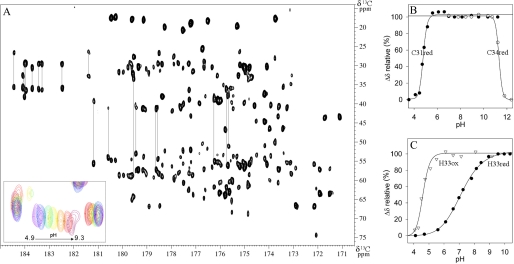
FIGURE 3.
pKa determination of all Dtrx ionizable residues. A, 600 MHz two-dimensional CBCACO spectrum of reduced Dtrx at 298 K, pH 5.7, showing the cross-peaks for the Cα-CO and Cβ-CO of all residues of the protein. Cross-peaks for the Cα-Cγ and Cβ-Cγ of Asn and Asp, and for the Cβ-Cδ and Cγ-Cδ of Gln and Glu are also visible and connected by lines. The inset shows a close-up view of the pH-dependent chemical shift variations for the Cβ-CO of Asp21 (pH 4.9 (pink), 5.6 (red), 6.1 (orange), 6.6 (yellow), 7 (green), 7.8 (blue), and 9.3 (purple)). B, pKa determination of the nucleophilic cysteine Cys31 (black circle) and cysteine Cys34 (white circle) in the reduced form of Dtrx. C, pKa determination of the histidine His33 in the oxidized form (white triangle) and reduced form (black circle) of Dtrx. The pH-dependent chemical shift variation of the Cβ carbons was measured, normalized, and fitted to one apparent pKa value using the Henderson-Hasselbach equation.

