FIGURE 5.
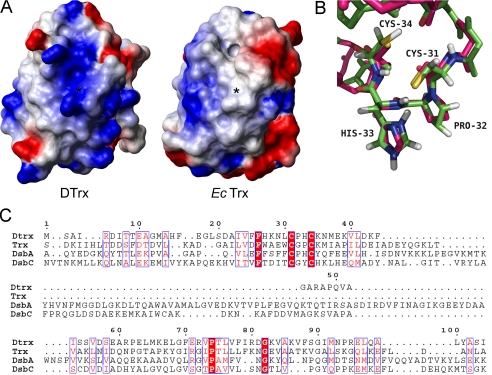
Comparative structural analysis of Dtrx. A, electrostatic surface potential representations of reduced Dtrx and reduced E. coli Trx, with blue representing basic residues, red representing acidic residues, and white representing neutral residues. The orientations of Dtrx and Trx are similar. The position of the sulfur atom of the N-terminal cysteine is indicated by a star. The hydrophobic patch observed in Trx is not conserved in Dtrx. Surface calculations were made using MolMol. B, superimposition of the redox active site of the reduced form of Dtrx (green) and E. coli DsbA (pink) in stick representation. The active site residues are labeled. C, sequence alignment of Dtrx, E. coli Trx, E. coli DsbA, and E. coli DsbC. Identical residues are in red boxes. Conserved residues are shown in red. The alignment was prepared with TCoffee (34) and ESPript (11).

