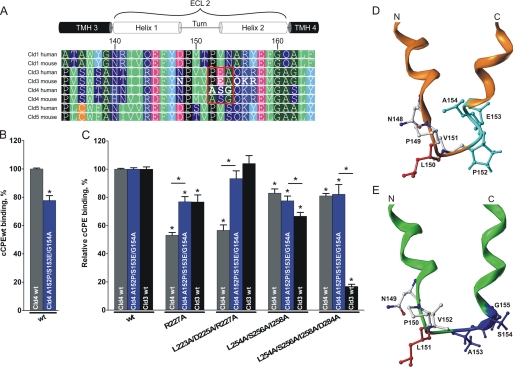
FIGURE 4.
Cld3-mimicking substitutions in Cld4 (A153P/S154E/G155A) decrease Cld4-related strong inhibitory effect of R227A and L223A/D225A/R227A in cCPE. A, sequence alignment of ECL2 of Cld1, 3, 4, and 5 (ClustalW2) is displayed using Geneious Pro version 5.3.4. Position numbering is according to murine Cld3. Red frame, striking difference between Cld3 and Cld4; green, bulky hydrophobic; dark green, small hydrophobic; dark blue, polar uncharged; blue, basic; magenta, acidic; cyan, Tyr; black, Pro; orange, Cys; bold letters, substituted residues; TMH, transmembrane helix. B and C, HEK cells expressing Cld3WT (black columns), Cld4WT (gray columns), or Cld4A153P/S154E/G155A (blue columns) were incubated with 0.5 μg/ml GST-cCPEWT or GST-cCPE mutant. Bound cCPE was detected using anti-GST antibodies in a plate reader. B, GST-cCPEWT binds to the Cld3-mimicking Cld4 mutant (Cld4A153P/S154E/G155A) more weakly than to Cld4WT. Results are mean ± S.E. (error bars); n ≥ 4. *, p < 0.05. C, quantification, normalized to GST-cCPEWT (relative binding) for each claudin construct. A153P/S154E/G155A induces a Cld3-like sensitivity of Cld4 to R227A and L223A/D225A/R227A mutants of cCPE. Results are mean ± S.E.; n ≥ 5. *, p < 0.05 to GST-cCPEWT. D and E, differences in the homologous helix-turn-helix model for ECL2 of Cld3 (orange) and Cld4 (green) are illustrated. Front view shows turn-flanking residues Leu150/Leu151 highlighted in red and the differing N-terminal cap conformation of the C-terminal helix in cyan (Cld3; based on PDB code 1W5C) or blue (Cld4; based on PDB code 2BDV).

